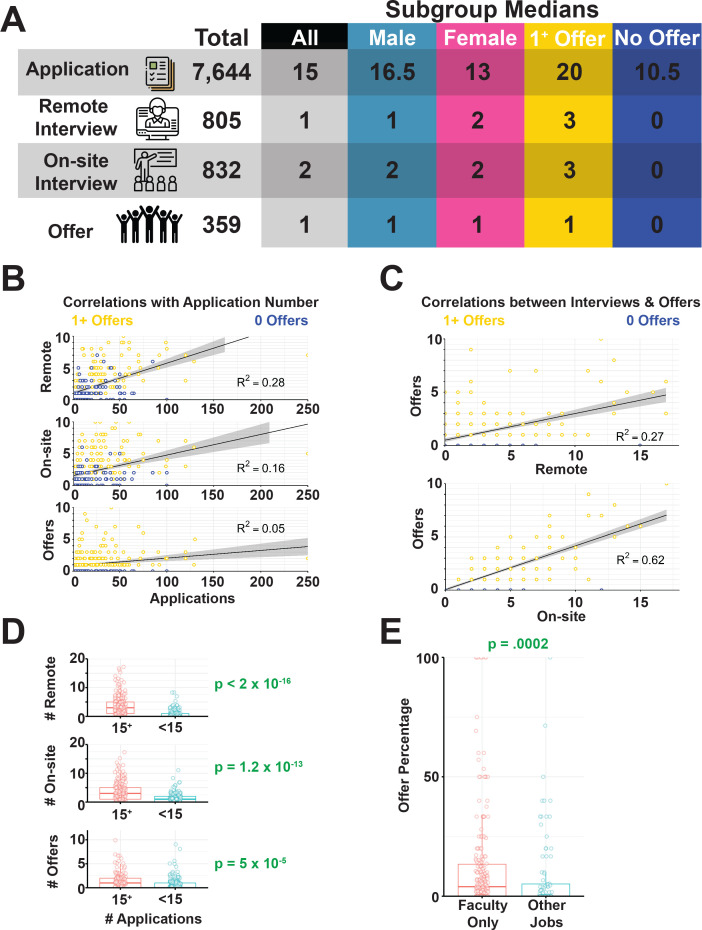
Figure 4. Job application benchmarks and their impact on success.
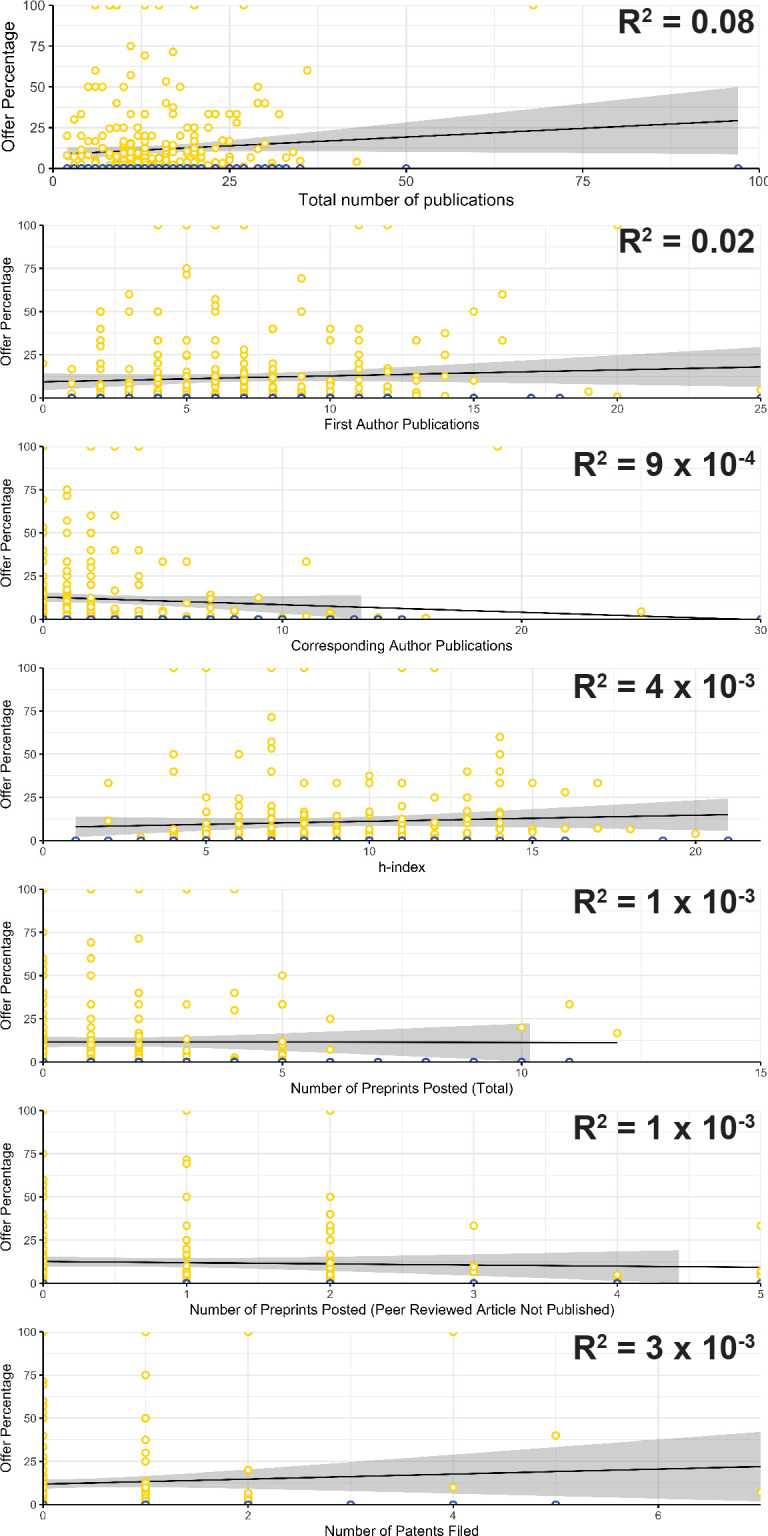
(A) Total and median numbers of applications, off-site interviews, on-site interviews and offers recorded in survey responses (Supplementary file 19). (B) Correlations between the total number of applications submitted and off-site interviews (top; R2 = 0.28), onsite interviews (middle) and offers (bottom; R2 = 4.77×10⁻²). (C) Correlations between the number of interviews completed and offers received (R2 = 0.62). See Figure 4—figure supplement 1 for more details. (D) Total number of off-site interviews (top, p<4.10×10⁻²⁴, on-site interviews (middle, p=1.20×10⁻¹³) and offers (bottom, p=5.0×10⁻⁵) for applicants who submitted at least 15 (the median) applications (in red) and less than 15 applications (in blue). (E) Fraction of applications that resulted in offers (offer percentages) for survey respondents who did not apply for jobs outside of faculty positions is significantly higher (p=2.0×10⁻³, Supplementary file 7) than for those who also applied for both academic and other types of jobs (Supplementary file 14).
Figure 4—figure supplement 1. Correlations between offer percentage and a number of traditional scholarly metrics.


