. 2020 Jun 12;9:e54097. doi: 10.7554/eLife.54097

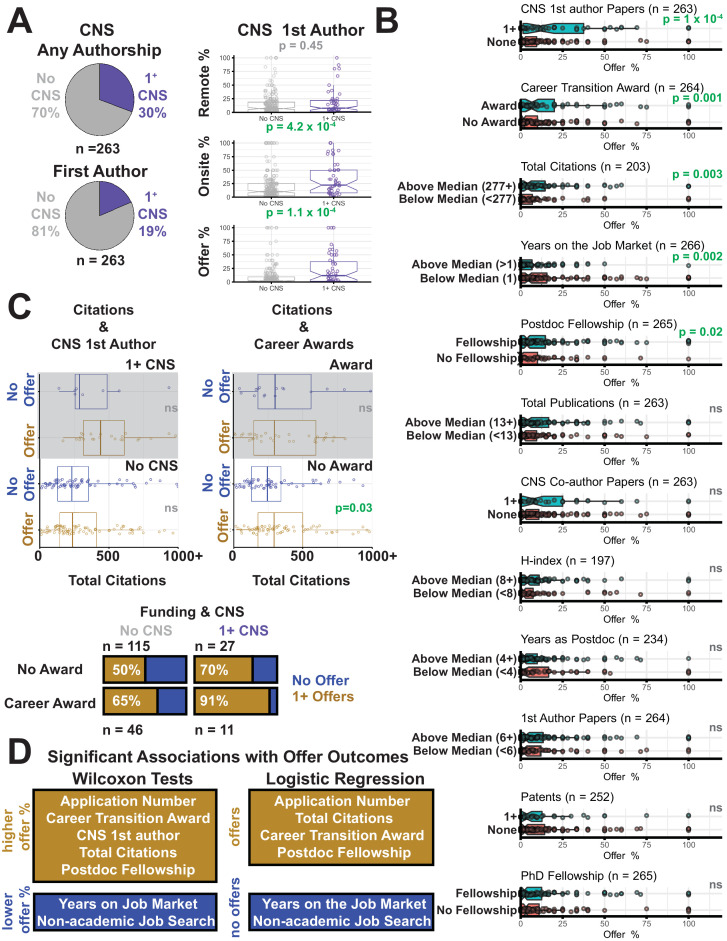
Figure 5. Traditional research track record metrics slightly impact job search success.

(A) Pie charts show the fraction of candidates with authorship of any kind on a CNS paper (purple) versus those without (gray), and fraction of candidates who were first author on a CNS paper (purple) versus those who were not (gray). Distributions of off-site interviews (top; p=0.33), onsite interviews (middle; p=2.70×10⁻⁴) and offers (bottom; p=1.50×10⁻⁴) for applicants without a first-author paper in CNS (gray), and those with one or more first-author papers in CNS (purple; Supplementary files 11, 12, 17). (B) Significant associations were found between offer percentage and the number of first-author papers in CNS (top panel, p=1.70×10⁻³), career transition awards (second panel, p=2.50×10⁻²), total citations (third panel, p=2.92×10⁻²), and years on the job market (fourth panel, p=3.45×10⁻²). No significant associations were found between offer percentage and having a postdoc fellowship (fifth panel), being above the median in the total number of publications (sixth panel), being an author in any position on a CNS paper (seventh panel), h-index (eighth panel), years as a postdoc (ninth panel), number of first-author papers (tenth panel), number of patents (eleventh panel), or graduate school fellowship status (twelfth panel; Supplementary files 6, 7, 9, 10, 11, 12, 13 and 21). (C) The plots show total citations for those without an offer (blue) and those with one or more offers (gold), for all applicants with one or more first-author papers in CNS (top left); for all applicants without a first-author paper on CNS (bottom left); for all applicants with independent funding (top right); and for all applicants without independent funding (bottom right). In two cases the p value is below 0.05. The bar charts show the offer percentages (gold) for the four possible combinations of career award (yes or no) and first-author paper in CNS (yes or no): for applicants with a first-author paper in CNS, p=0.56, χ2 = 0.34; for applications without, p=0.17, χ2 = 1.92). (D) Summary of significant results testing criteria associated with offer outcomes through Wilcoxon analyses (Supplementary file 7) or logistic regression (Supplementary file 24).

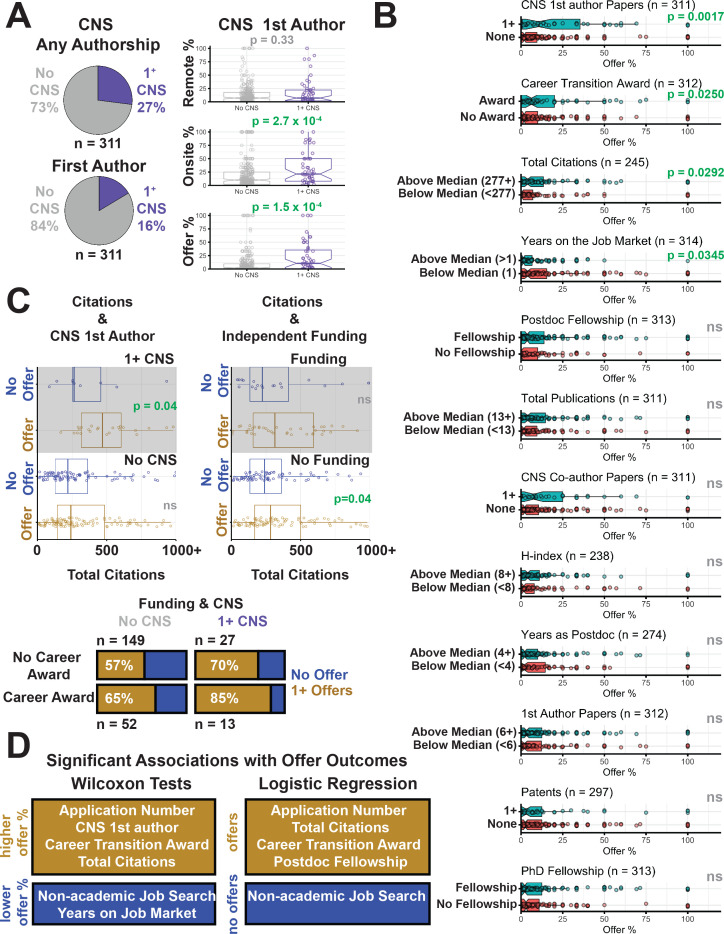
Figure 5.

Figure 5—figure supplement 1. Life-science specific analysis of applicant survey outcomes.

Figure 5—figure supplement 1.

We performed identical analysis as in Figure 5 but restricted to applicants (n = 269) who described their field as life-science related (as defined in Figure 2).
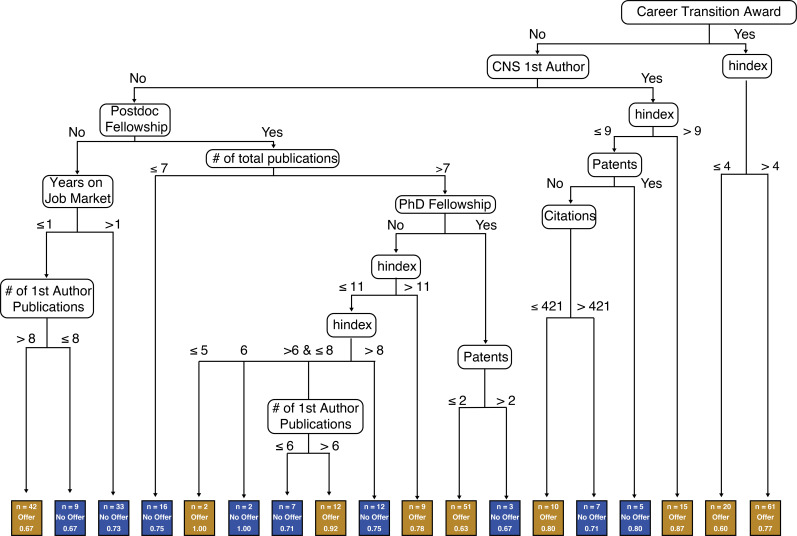
Figure 5—figure supplement 2. Visualization of possible paths to an offer using the C5.0 decision tree algorithm.

Figure 5—figure supplement 2.

Each rounded node represents an independent variable and each rectangular node represents one of two possible outcomes (offer (gold) or no offer (blue)). Only those variables in Figure 5B were included. In the case of binary variables such as funding and fellowships, ">0" indicates a "yes" and "<=0" indicates a "no". All other variables, except for h-index, were split based on counts. The outcome nodes are labeled with three pieces of information: (Cyranoski et al., 2011) the number of applicants who fell into the given branch (n), (Ghaffarzadegan et al., 2015) the most common outcome in that branch, and (Schillebeeckx et al., 2013) the fraction of individuals with that outcome. For example, the rightmost branch shows applicants who had a career transition award and h-index >4. They constitute the largest group in our dataset (61 individuals). However, only 77% of these applicants received an offer. Similarly, the second and third largest groups included 51 applicants (63% with offer) and 42 applicants (67% with offer) respectively (see eighth outcome box from right and leftmost box). These three groups accounted for 48.6% of our survey respondents. Note that while decision trees have often been used as prediction models, this tree is only reflective of our dataset and choice of algorithm and parameters. We have used this solely for visualization purposes and advise against using this prospectively to evaluate chances of success on the job market as there may be alternative trees that are equally plausible and accurate. In fact, the accuracy of the overall decision tree in distinguishing between candidates with offers and those without was only 58.5%. Furthermore, no group with more than two applicants consisted purely of those with offers and those without. Even in the nine groups where the most common outcome was "no offer", on average, 25% of the applicants did receive offers.