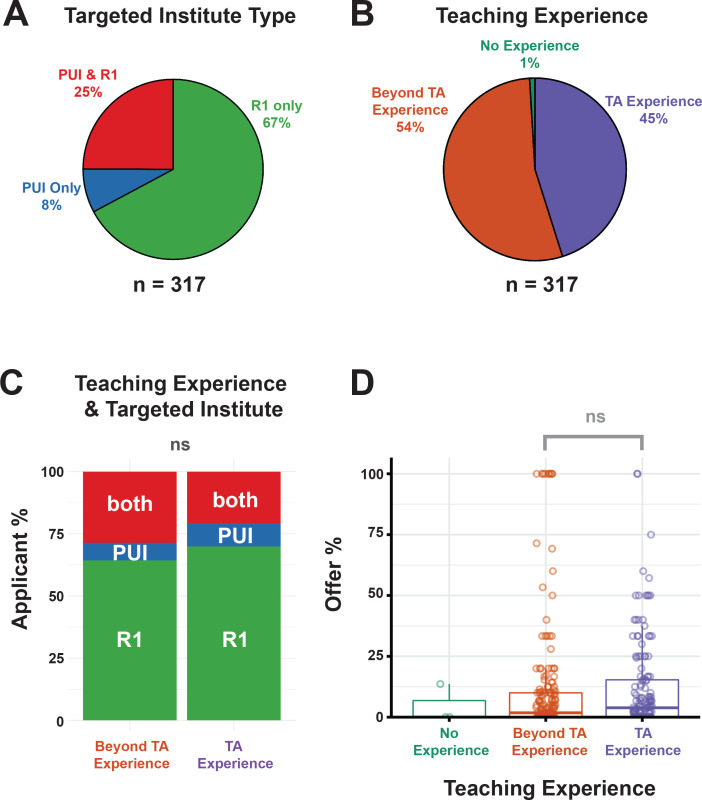
Figure 6. Summary of applicant teaching experience and impact on job search success.
(A) Distribution of institution types targeted by survey applicants for faculty positions (PUI only in blue, R1 institutions only in green, or both in red, Supplementary file 26). (B) Distribution of teaching experience reported by applicants as having TA only experience (in purple), beyond TA experience (e.g. teaching certificate, undergraduate and/or graduate course instructorship, guest lectureship and college adjunct teaching, (in orange), or no teaching credentials (in green; Supplementary files 27 and 28). (C) Distribution of teaching experience (TA experience, right, vs. Beyond TA experience, left) for applicants who applied to R1 institutions only (in green), PU institutions only (blue), or both R1 and PUIs (in red), (Supplementary file 27). The degree of teaching experience did not change based on the target institution of the applicant (p=0.56 (ns), χ2 = 0.41; Chi-squared test). (D) Association between offer percentage and teaching experience is not significant (p=0.16; Supplementary files 7, 27 and 28).

