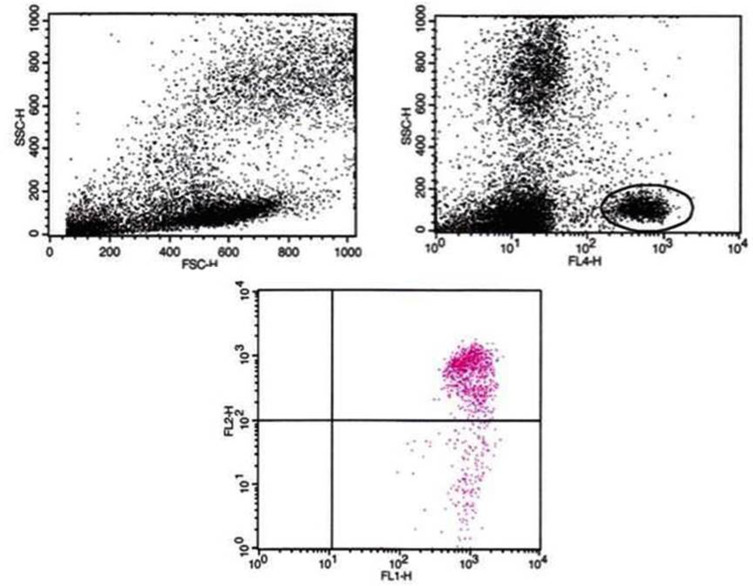
Figure 4.
Sample PBMC measurement results using JC-10 dye.
Notes: Gating the T cells via FL-4/CD3APC and the evaluation of PBMCs using FL1 versus FL2. Upper-right quadrant shows cells with high membrane potential in black. FL4 represents CD3, therefore the black circle marks T cells. Lower quadrant shows cells with reduced membrane potential in red.
Abbreviation: PBMC, peripheral blood mononuclear cell.

