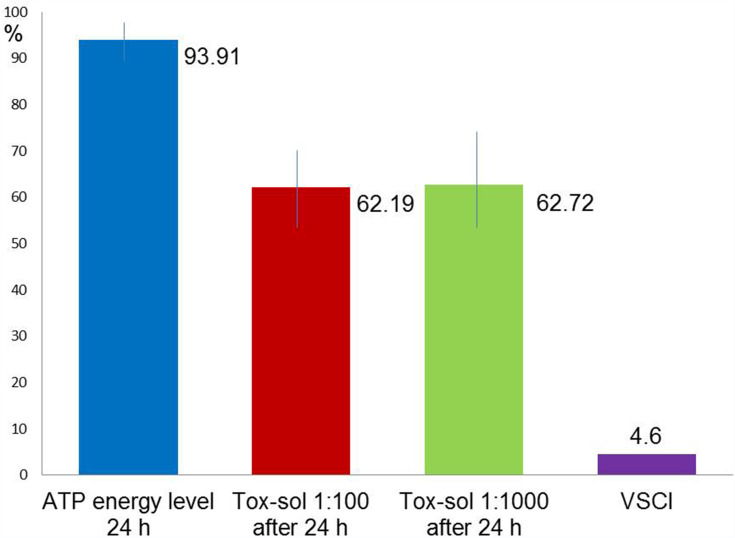
Figure 11.
Mean ATP activity values based on a reduction in the maximum ATP activity levels among all groups.
Notes: The column at the very right shows the mean VSCI value of 4.6 all groups, i.e. all patients.
Abbreviations: h, hours; ATP, adenosine triphosphate; Tox-sol, toxin solution; VSCI, volatile sulfur compound indicator.

