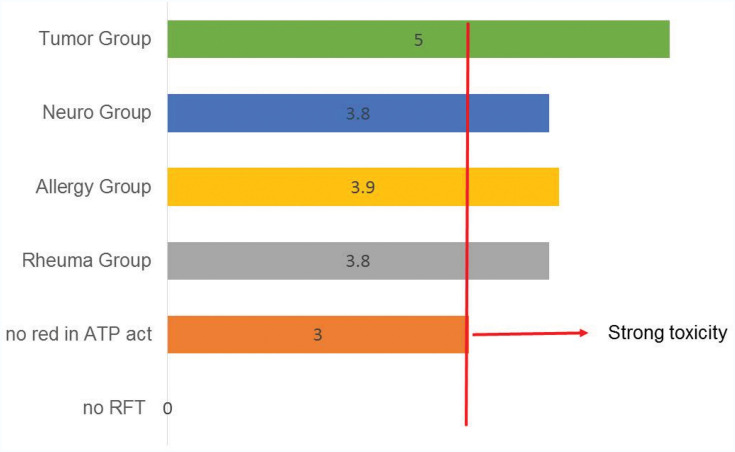
Figure 16.
This diagram shows the VSCI values for the different groups.
Note: There is a clear co-incidence of high VSCI values and a reduction in ATP activity.
Abbreviations: Neuro, neurology; Rheuma, rheumatism; ATP, adenosine triphosphate; red, reduction; act, activity; RFT, root-filled teeth; VSCI, volatile sulfur compound indicator.

