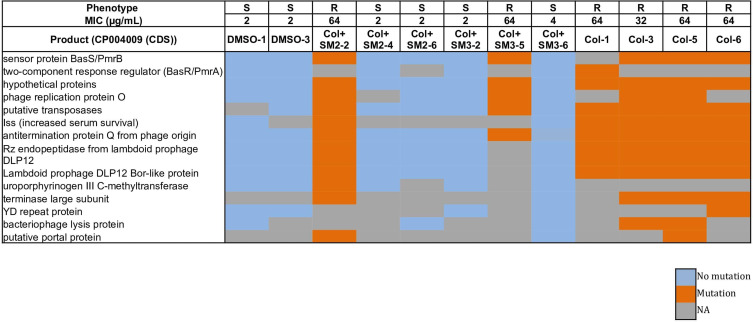
Figure 3.
Heatmap displaying the non-synonymous mutational comparison between ColR isolates (Col-1, Col-3, Col-5, Col-6, Col + SM2-2 and Col + SM3-5) as compared to ColS (DMSO-1, DMSO-3, Col + SM2-4, Col + SM2-6, Col + SM3-2 and Col + SM3-6) isolates. Phenotype “R” indicates resistant APEC isolate and “S” indicates susceptible APEC isolate.
Abbreviation: NA, not available.

