
FIGURE 2.
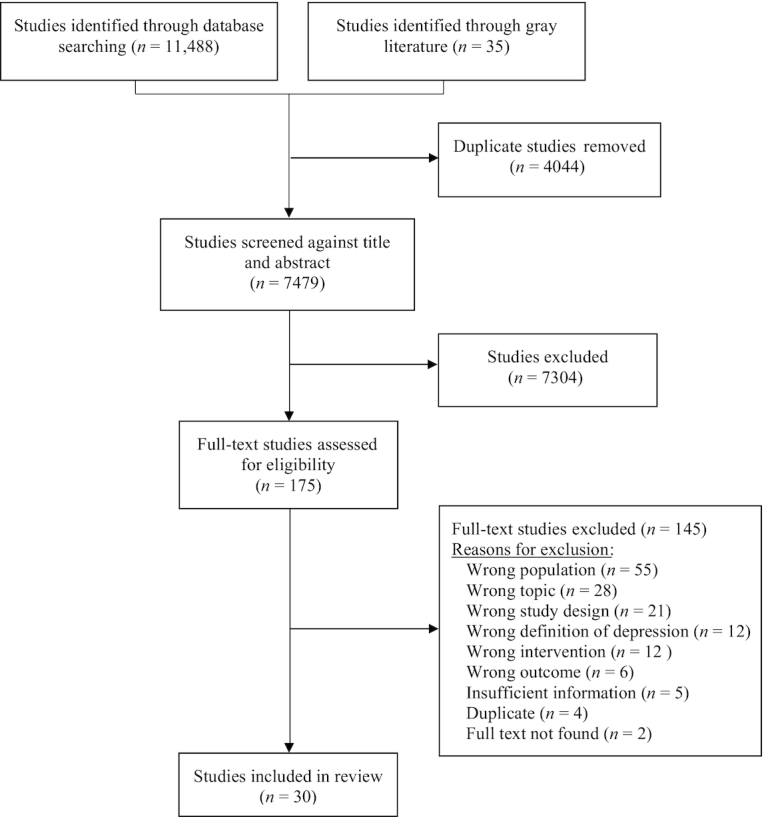
The PRISMA flow diagram illustrates the flow of the number of articles identified, included, and excluded through the different phases of the evidence gap map.
Official websites use .gov
A
.gov website belongs to an official
government organization in the United States.
Secure .gov websites use HTTPS
A lock (
) or https:// means you've safely
connected to the .gov website. Share sensitive
information only on official, secure websites.
The PRISMA flow diagram illustrates the flow of the number of articles identified, included, and excluded through the different phases of the evidence gap map.