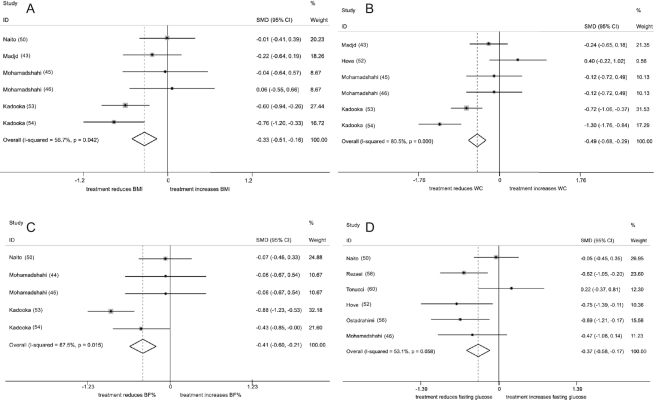
FIGURE 3.
Forest plot of meta-analysis of randomized controlled trials that assess the effect of probiotic supplementation into a dairy matrix and anthropometric parameters on overweight and obese subjects and on diabetic biomarkers in subjects with type 2 diabetes. A: BMI changes (P < 0.001). B: WC changes (P < 0.001). C: BF changes (P < 0.001). D: Fasting glucose changes (P < 0.001). BF, body fat; SMD, standard mean difference; WC, waist circumference.

