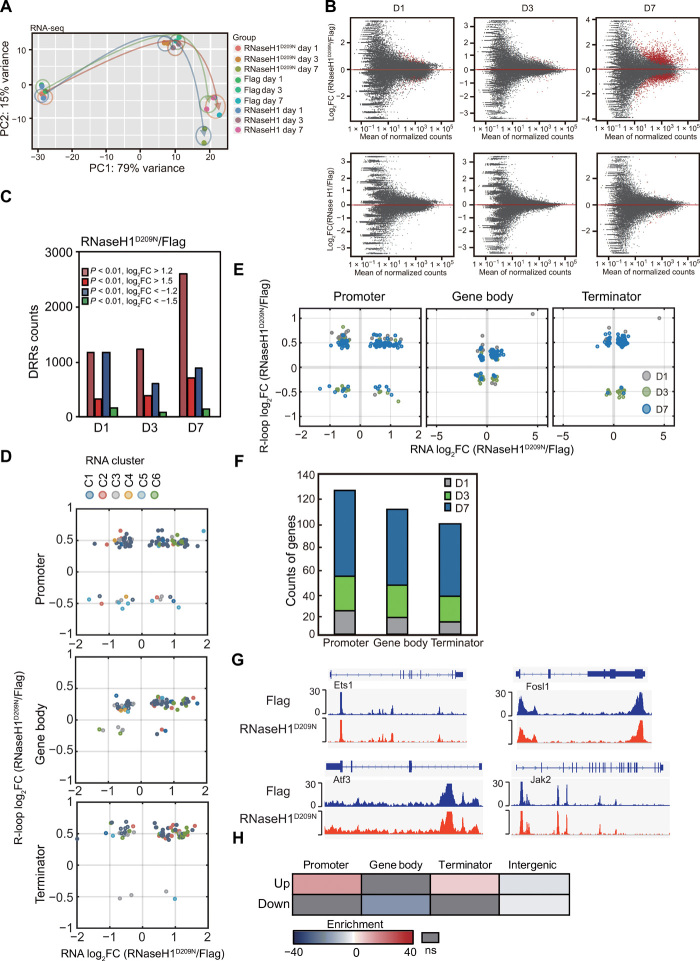
Fig. 3. RNaseH1D209N induces R-loop accumulation and changes gene expression during reprogramming.
(A) PCA of RNA-seq signals in cells transfected with OSKM and Flag, RNaseH1, or RNaseH1D209N during reprogramming. (B) MA plots showing the DEGs (red dots) of RNaseH1D209N/Flag and RNaseH1/Flag during reprogramming. (C) Statistics of up- or down-regulated differential R-loop regions (DRRs) of RNaseH1D209N compared with Flag during reprogramming. (D) Scatterplots of gene expression and R-loop log2 fold change (RNaseH1D209N/Flag, D7). (E) Scatterplots of RNA (x axis, D7) and promoter, gene body, or terminator R-loop (y axis, D1, D3, D7) of RNaseH1D209N compared with controls on concurrently changed genes. (F) Counts of Prom-/Gb-/Term-concurrently changed genes shown in (E) on D1, D3, and D7 during reprogramming. (G) Snapshots of ATAC-seq of MEFs reprogrammed with OSKM plus Flag and RNaseH1D209N on day 7 at representative genomic loci. (H) Colocalization analysis of total ATAC peaks (RNaseH1D209N + Flag, D7) and up- or down-regulated differential R-loop regions (RNaseH1D209N/Flag, D7) in promoter, gene body, terminator, and intergenic regions.

