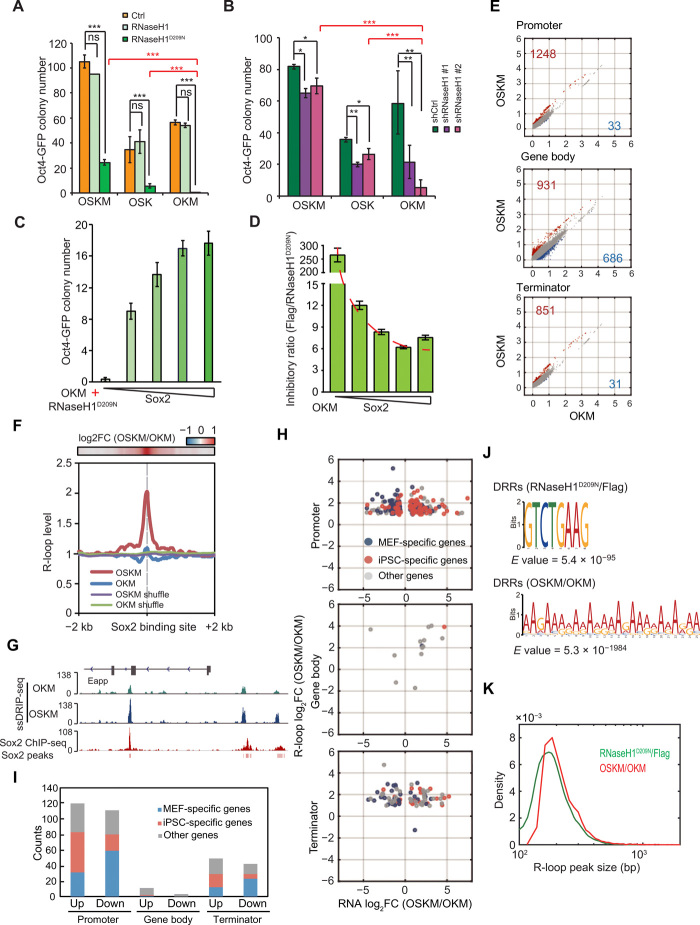
Fig. 4. Sox2 partially rescues the inhibitory effect of aberrant R-loops on reprogramming.
(A) Oct4-GFP colony number of MEFs reprogrammed with OSKM, OSK, OKM plus Flag, RNaseH1, or RNaseH1D209N. (B) Oct4-GFP colony number of MEFs reprogrammed with OSKM, OSK, OKM, and shRNAs against control or RNaseH1. (C) Oct4-GFP colony number of MEFs reprogrammed with OKM, RNaseH1D209N, plus various concentrations of Sox2 virus (0, 50, 100, 150, and 200%). (D) Inhibitory ratio of reprogramming corresponding to (C). (E) Scatterplots of R-loop (OSKM/OKM, D9). The counts of up- or down-regulated DRGs are shown. (F) The metaplot of R-loop of MEFs, reprogrammed with OKM and OSKM, on Sox2 binding sites. (G) Snapshots of ssDRIP-seq of MEFs reprogrammed with OKM and OSKM on Sox2 binding peaks. (H) Scatterplots of RNA and R-loop (OSKM/OKM, D9). The concurrently changed genes are shown and classified as MEF-specific, iPSC-specific, or other genes. (I) Statistics of concurrently changed genes shown in (H). (J) DNA motif of differential R-loop regions of RNaseH1D209N/Flag and OSKM/OKM. (K) Peak size distribution of differential R-loop of RNaseH1D209N/Flag and OSKM/OKM. Error bars correspond to means ± SD (*P ≤ 0.05, **P ≤ 0.01, ***P ≤ 0.001, two-tailed Student’s t test).

