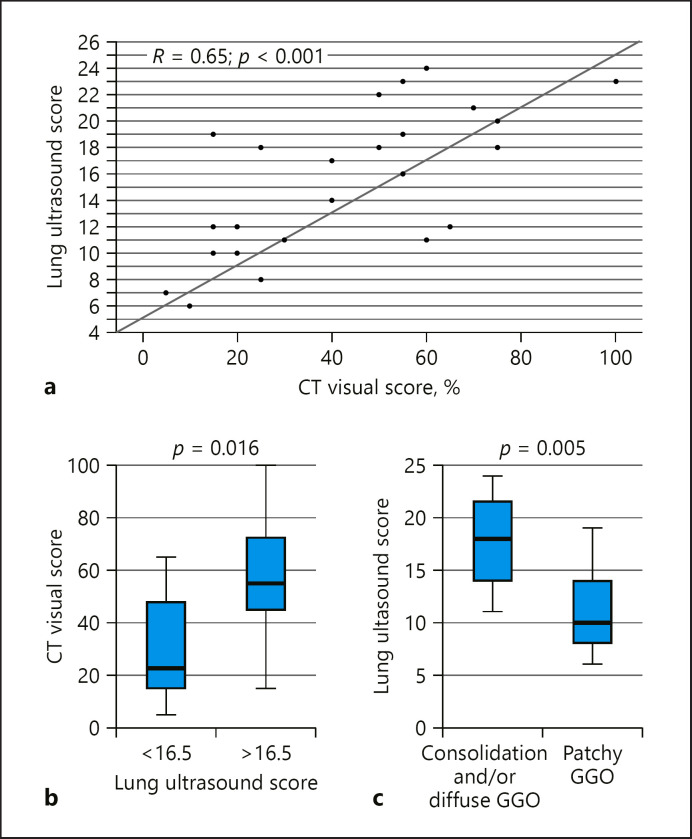
Fig. 2.
Spearman correlation between lung ultrasound (LUS) score and CT visual scoring (a). The CT visual score was significantly different (p = 0.016) between patients with LUS score below and above the median value (b). The LUS score was also significantly different (p = 0.005) in patients who exhibited consolidation and/or diffuse ground-glass opacities (GGO) at chest CT versus those who had a patchy GGO pattern (c).

