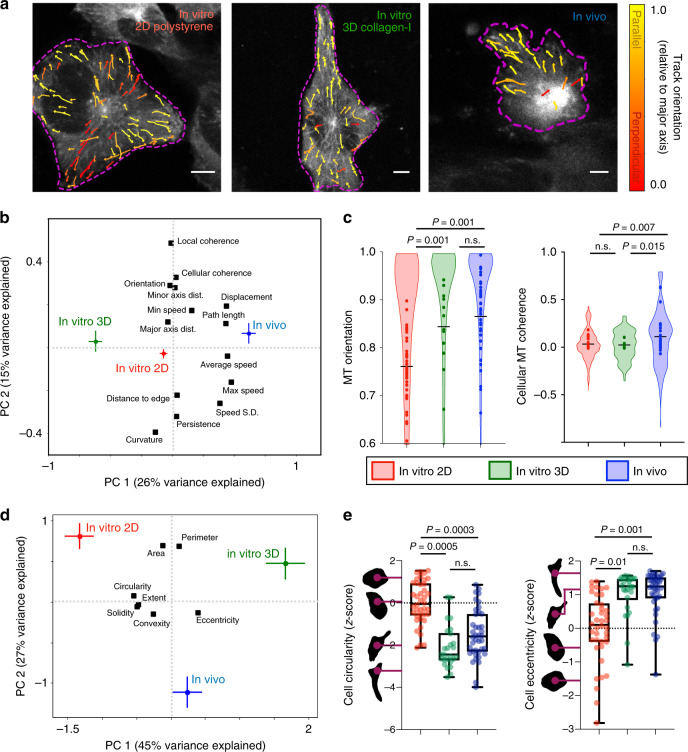
Fig. 2. Coherent in vivo MT dynamics are not fully reproduced by 3D collagen in vitro cultures.
a Representative confocal images of HT1080-EB3-mApple cells grown as indicated, with tracks pseudo-colored according to MT orientation along the major length axis of the cell (scale bar = 5 μm; n = 85 cells across n ≥ 2 in vitro replicates and n = 4 tumors). b MT features were analyzed by principal components analysis (PCA), shown according to average condition score (±s.e.m.) and variable loadings (black squares; n = 5794 tracks, middle 95% for all features). c Violin plots show single-track distributions for orientation and cellular coherence (bar denotes median, cell averages overlaid as individual data points; *two-tailed permutation test; n = 9448 total tracks from 85 cells). d PCA captures covariation between cellular shape features (loadings, black) across imaging conditions (scores ±s.e.m.; n = 106 cells). e Single-cell distributions of shape features, matching d (*two-tailed t test; n = 106 cells; box plot bars represent the minimum, 25%tile, median, 75%tile, and maximum values). Source data are provided as a source data file.

