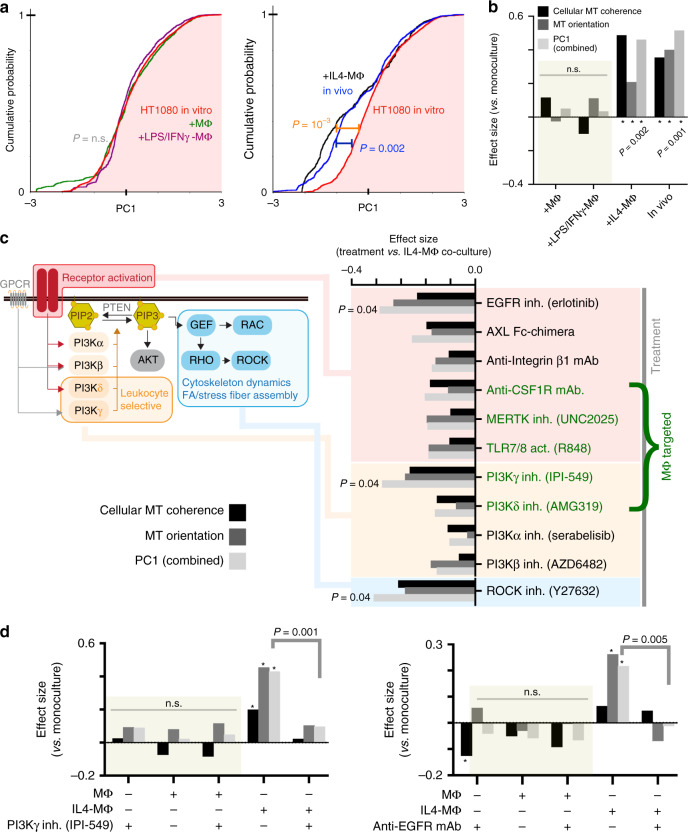
Fig. 5. Disruption of MΦ-induced MT coherence by targeted inhibition of cell signaling.
a HT1080 MT cellular coherence and orientation were combined into a principal component (PC) for each MT track, and the cumulative distribution function of PC scores was calculated (*two-tailed permutation test; total n = 10,968 tracks from n = 118 total cells). b Effect sizes were calculated from results shown in (a) (*two-tailed permutation test using PC scores). c ES2 MT dynamics were imaged after 24 h co-culture followed by 2–4 h of drug treatment, and effect sizes were calculated as in (b), however, here in comparison to IL4-MΦ co-culture (*two-tailed permutation test on PC scores with BH multiple hypothesis correction, fdr = 0.05; n = 29,591 tracks from n = 151 total cells). d HT1080 MT dynamics were imaged after 24 h co-culture followed by 2–4 h. of drug treatment, and effect sizes were calculated as in (b) (*two-tailed permutation test on PC scores; IPI-549: n = 13,380 tracks from n = 80 total cells; anti-EGFR mAb: n = 16,427 tracks from n = 112 total cells). Source data are provided as a source data file.

