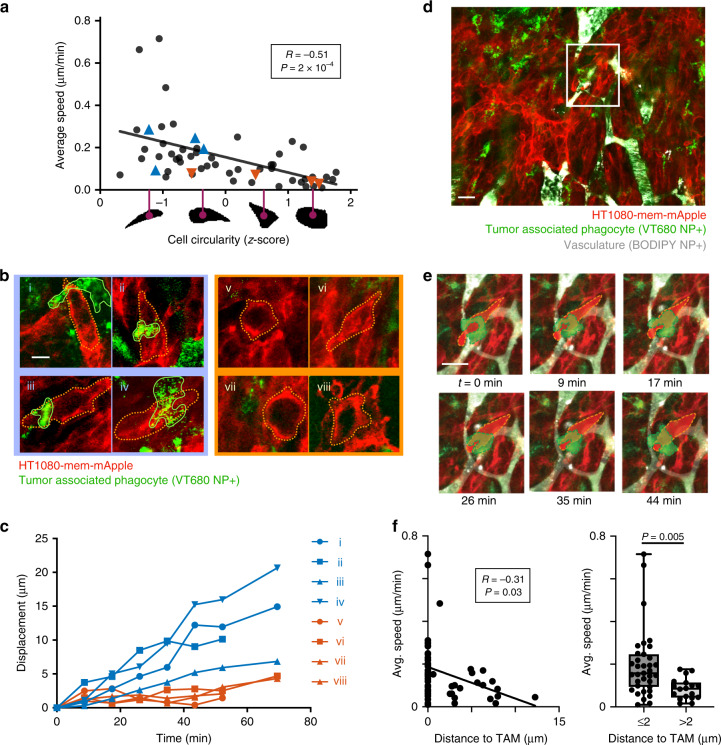
Fig. 7. TAMs associate with pseudopod-like protrusions in migrating cancer cells.
Time-lapse IVM tracked migration of individual HT1080-mem-mApple cells in tumors within the dorsal window chamber model. a Migration speed was correlated with cell circularity (data points are n = 50 individual cells across n = 4 tumors; *two-tailed f test on cell level data). Blue and red correspond to cancer cells associated with TAMs or not, respectively, in (b–c). Representative tumor cells associated with TAMs (i–iv) or not (v–viii) are shown (b; scale bar = 10 μm) with corresponding migration (c). Example TAM-associated, migrating HT1080 cell is highlighted from a 20× field of view (d; scale bar = 20 μm) and corresponding time-lapse (e; scale bar = 20 μm). Cells have been shaded for visualization. f Migration speeds of individual HT1080 cells were compared with their nearest distance to TAMs, shown fit to a regression (left; Pearson’s coefficient and two-tailed t test) and binned by distance (right; *two-tailed t test on cell level data; box plot as min, 25%tile, median, 75%tile, and max; e, f n = 55 cells across n = 4 tumors). Source data are provided as a source data file.

