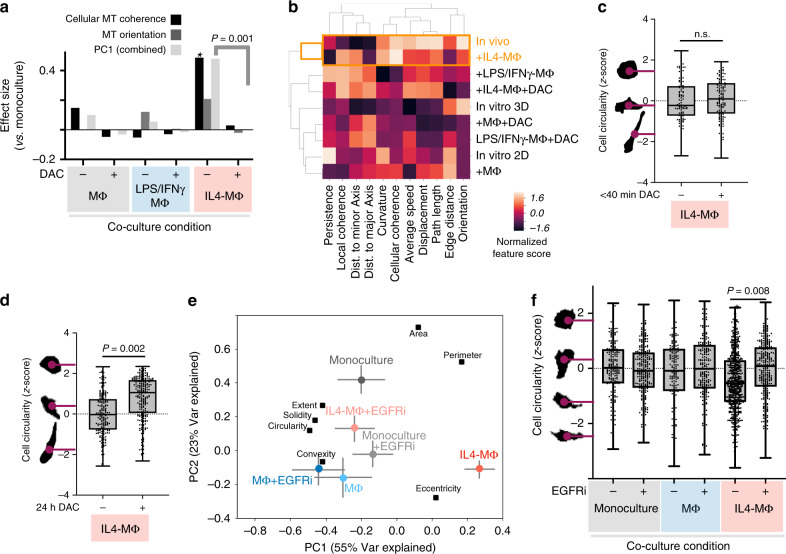
Fig. 8. Drug-induced changes in MT dynamics precede changes in overall cell shape.
a After 24 h co-culture, HT1080 MT dynamics were imaged from 5–40 min following 10 μM mTOR/pan-PI3K inhibitor dactolisib (DAC), and effect sizes were calculated as in Fig. 5a, b, comparing to untreated monoculture (*two-tailed permutation test; n = 12,524 tracks from n = 109 total cells). Corresponding to a, MT tracks were clustered according to average values (b), and tumor cell shape quantified following DAC at <40 min (c) or 24 h (d) post treatment (*two-tailed Mann–Whitney U test; c n = 223 cells, d n = 413 cells). e–f HT1080 were treated for 24 h with anti-EGFR mAb (EGFRi), quantified for cell shape, and analyzed by PCA (e n = 1594 total cells; mean ± s.e.m.) and for cell circularity (*two-tailed t test; n = 1678 cells; bar denotes median). All box plots are min, 25%tile, median, 75%tile, and max. Source data are provided as a source data file.

