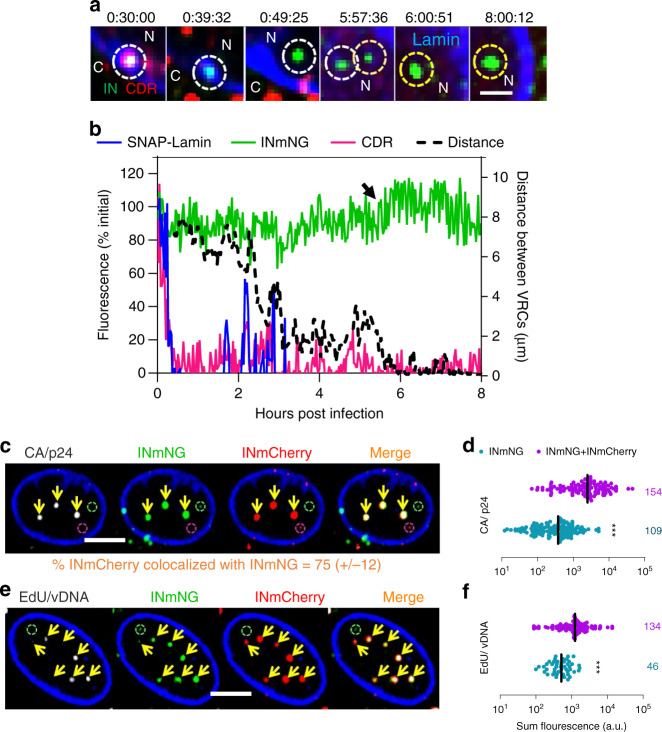
Fig. 1. Multiple HIV-1 complexes traffic to distinct nuclear locations in MDMs.
a, b MDMs expressing SNAP-Lamin (blue) and infected at MOI 0.5 (corresponding to <30% infection of Vpx(+) treated cells after 5 days) with VSV-G pseudotyped HIV-1 co-labeled with INmNG and CDR were imaged at 90 s/frame consisting of 15 Z-stacks for 0.5–8 h. a Single Z-slice images with time stamps showing an IN/CDR co-labeled particle (white dashed circle) docked at the nuclear envelope that loses CDR and enters the nucleus. After nuclear entry of a second IN-labeled complex (orange dashed circle), the two complexes traffic toward each other, merge (yellow dashed circles) and stay together till the end of the experiment (see Supplementary Movie 1). b Mean fluorescence intensities of the single virus marked by white dashed circle in (a). The increase in INmNG signal at 6 h (arrow) represents merger of two nuclear IN complexes. Distance between the two IN complexes in (a) is plotted in the 2nd Y-axis (right). c–f Untreated MDMs were co-infected with HIV-1 labeled with INmNG or INmCherry markers at a total MOI of 1 for 24 h in the absence (c, d) or presence (e, f) of 5 μM EdU. Cells were fixed and immunostained for CA/p24 (c, d) or stained for EdU by click-labeling (e, f). c, e Images of a 2-µm-thick central Z-projection of the MDM nucleus showing merged (double positive) VRC clusters colocalized with (yellow arrows) CA (c) and EdU (e). Single-colored INmCherry or INmNG VRCs are marked by red and green dashed circles, respectively. d, f Fluorescence intensities of CA and EdU of double- vs. single-color INmNG puncta are shown. Scale bars are 1 μm in (a) and 5 μm in (c, e). Data in (d, f) are presented as median values ± SEM at 95% CI (confidence interval). N > 50 nuclei from three independent donors/experiments. The total number of IN puncta analyzed is shown on the right. Statistical significance in (d, f) was determined using a nonparametric Mann–Whitney rank-sum test, ***p < 0.001. Source data are provided as a Source Data file.

