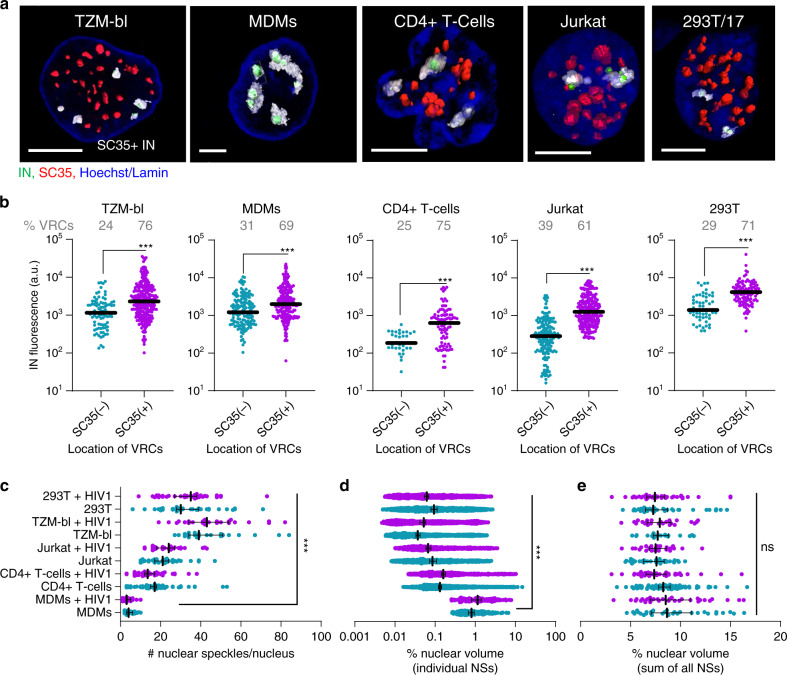
Fig. 3. NSs are preferred HIV-1 accumulation sites in different cell types.
a–e MDMs, HEK293T, and TZM-bl cells were infected at MOI of 5 (determined on TZM-bl cells); Jurkat cells and primary CD4+ T cells were infected in suspension with the same virus supernatant and later adhered to a 8-well coverslip for microscopy analysis. All cell types were fixed at 6 hpi (uninfected cells were used as controls). Cells were immunostained for NSs (SC35) and lamin in TZM-bl and MDMs; the nuclei of T cells and HEK293T cells were stained with Hoechst-33342. NSs (SC35(+)) compartments were identified by three-dimensional image analysis. a 3D-rendered of images showing NSs (red), IN puncta (green), and nuclei (blue). NSs encompassing HIV-1 complexes are colored transparent gray. Scale bar: 5 μm. (b) Fluorescence intensities of IN puncta inside (SC35(+)) and outside (SC35(−)) nuclear speckles. c The number of NSs per nucleus in different cell types. d Percent of nuclear volume occupied by individual NSs. e Percent of nuclear volume occupied by all speckles. Infected cells (red symbols) are marked with cell type name +HIV-1. Data in (b–e) are presented as median values ± SEM at 95% CI. N > 50 nuclei for each cell type from >3 independent experiments in HEK293T and Jurkat cells, from three donors in primary CD4+ T cells, and >5 independent experiments in TZM-bl cells and MDMs. A total of 124 nuclear IN puncta were analyzed in CD4+ T cells and >200 IN puncta were analyzed in all other cell types (b). Statistical significance between uninfected MDMs and other cell types in (b–e) was determined using a nonparametric Mann–Whitney rank-sum test. ***p < 0.001. Differences in the number NSs between uninfected and HIV-infected cells in each cell type were insignificant, p > 0.05. Images in (a) are representatives of >120 nuclei from at least three independent experiments. Source data are provided as a Source Data file.

