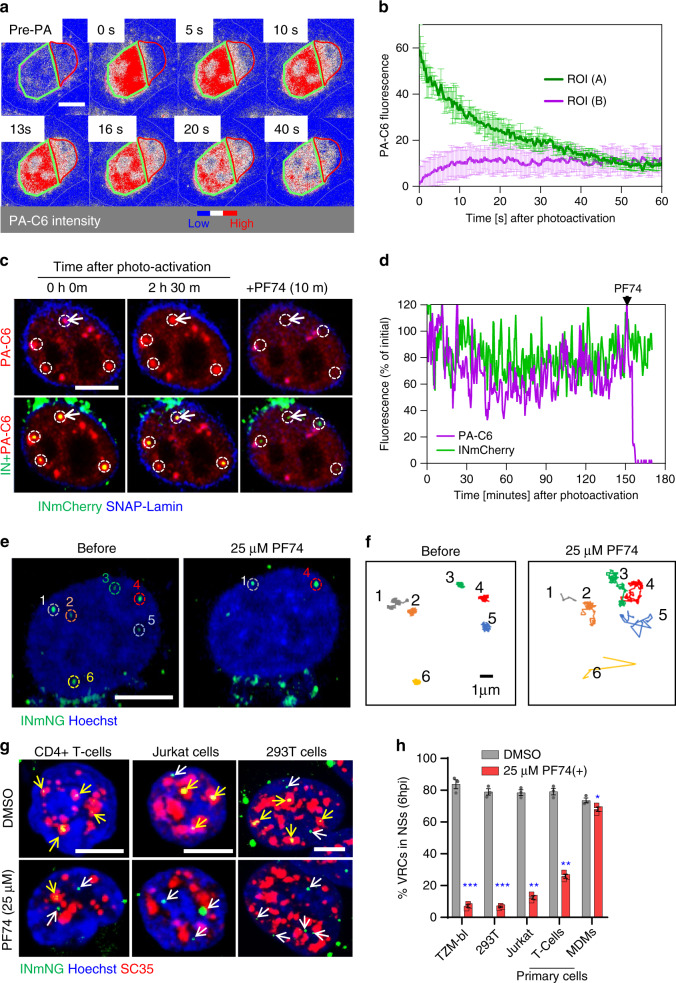
Fig. 5. CA-dependent interactions tether VRCs to NSs.
a, b CPSF6 fusion with photoactivatable GFP (PA-C6) transiently expressed in TZM-bl cells is highly mobile in the nucleus. Images (a) and quantification (b) of redistribution of photoactivated PA-C6 from the illuminated region (green contour, A) into a non-photoactivated region (red contour, B) in a central Z-plane of the nucleus. PA-C6 fluorescence is represented as a heatmap. c, d A subset of PA-C6 is tightly associated with nuclear VRCs. Images (c) and fluorescent intensity trace (d) of INmCherry-labeled nuclear VRCs (dashed white circles) co-trafficking with photoactivated PA-C6 (red) in cells expressing SNAP-Lamin (blue). Imaging started at 4 hpi. PA-C6 was photoactivated at the location of VRCs and live-cell imaging was performed at 20 s/frame for 2.5 h, at which point, addition of 25 µM PF74 displaced PA-C6 from VRCs. The fluorescence intensity trace in (d) corresponds to VRC in the top-left corner (white arrow in (c)). e, f Addition of PF74 results in rapid displacement of VRCs from their location. TZM-bl cells (nuclei stained with Hoechst) were infected with INmNG-labeled HIV-1 for 4 h, and trafficking of nuclear VRCs was imaged at 5 s/frame for 30 min. Images (e) and single-particle trajectories (f) of nuclear INmNG puncta before and after 25 μM PF74 treatment correspond to VRCs marked by dashed circles in panel (e). g, h Images and quantification of the fraction of NS-localized VRCs in different cell types untreated or treated with PF74. MDMs, HEK293T, TZM-bl cells, Jurkat cells and primary CD4+ T cells were infected, as described in Fig. 3. Where noted, 25 μM PF74 was added 30 min before fixation at 6 h. Cells were immunostained for NSs (SC35), and the number of IN puncta inside and outside of NSs was determined. Scale bars in (a, c, e, g) are 5 μm. Error bars are mean ± SEM. N = 20 nuclei in (b) and >120 nuclei in (h) from three independent experiments. Significance relative to DMSO control was determined by two-tailed Student’s t test (*p = 0.0365; **p < 0.01; ***p < 0.001). Source data are provided as a Source Data file.

