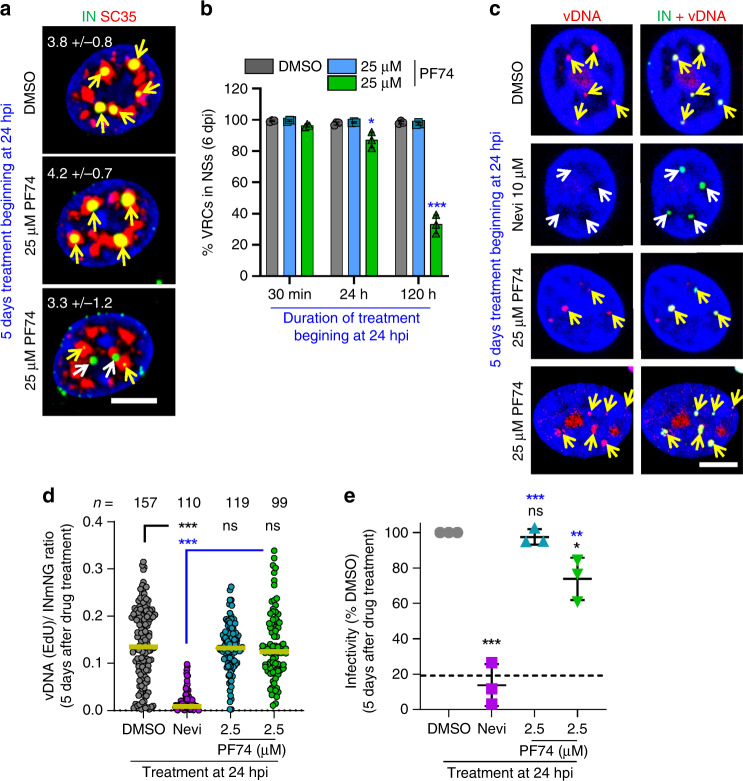
Fig. 7. PF74-resistant nuclear VRC clusters in MDMs continue to synthesize vDNA.
Treatment with 25 µM PF74 promotes slow exit of VRCs from NSs of MDMs, without affecting vDNA synthesis. MDMs were infected with INmNG-labeled HIV-1 (a–d) for 24 h, at which time PF74, DMSO, or Nevi was added without (a, b, e) or with 5 μM EdU (c, d), and incubated for different time, as indicated. Cells were fixed and stained for NSs (SC35) (a, b) or vDNA (c, d). a, b Images and quantification of the fraction of nuclear VRCs colocalized with SC35 compartments; c, d images and EdU/vDNA staining of nuclear IN puncta after treatment with DMSO and PF74 at 24 hpi. Fluorescence intensities of EdU and INmNG of nuclear VRCs in panel (d) were measured and the ratio of EdU/vDNA to INmNG signals was plotted. e HIV-1 infection of MDMs becomes resistant to PF74 treatment after 24 h. MDMs infected with VSV-G pseudotyped pNL4.3 R-E-Luc were treated with indicated drugs beginning at 24 hpi. Cells were cultured for additional 5 days in the presence of drugs; luciferase activity was measured in triplicate and normalized to DMSO control. Each data point in (e) represents infectivity from an independent donor, dashed black line denotes the fraction of completion of vDNA synthesis at the time of drug addition (24 h). Scale bars in (a, c) are 5 μm. The average number of nuclear VRCs (±SD) detected in >60 nuclei from three experiments is overlaid on images in (a). Mean values ± SEM are shown in panels (b, e). Yellow line in (d) shows median values at 95% CI from three independent experiments/donors for >80 nuclei; the total number of nuclear IN puncta analyzed is shown. Significance in (b) and (e) (black—relative to DMSO, blue—nevirapine) was determined by two-tailed Student’s t test. p values in (d) were determined by a nonparametric Mann–Whitney rank-sum test. *p = 0.0228 in (b), p = 0.0138 in (e); ***p < 0.001 in (b, d, e). Images in (a, c) are representative of >120 nuclei, from three independent experiments/donors. Source data are provided as a Source Data file.

