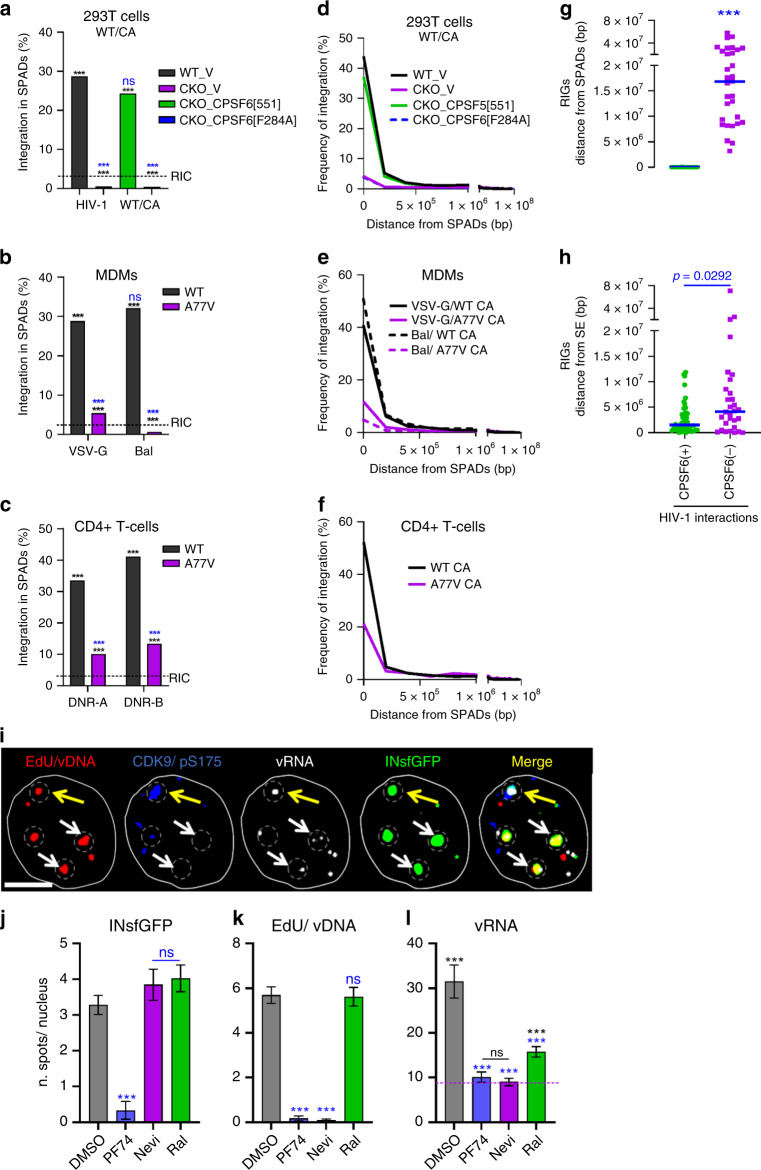
Fig. 8. HIV-1 integration favors NS-associated genomic loci.
a, d Analysis of HIV-1 integration preferences into SPAD regions in WT and CKO HEK293T cells transduced with empty expression vector (WT_V and CKO_V, respectively) or CKO cells transduced with vector expressing WT or F284A CPSF6 protein. b, e MDMs infected with single-round VSV-G pseudotyped or replication-competent (Bal) virus. c, f Primary CD4+ T cells derived from two blood donors A and B. a–c Percentage of HIV-1 integration sites within SPAD regions. d–f Frequency distribution of all integration sites as a function of their distance from closest SPAD, bin sizes are 200 kb. g, h CPSF6-dependent integration targeting of SPADs. Distances of RIGs from SPADs (g) vs. SEs (h). In (a–c), p values relative to matched WT conditions (blue asterisks) and to RIC (black asterisks) were calculated by Fisher’s exact test. A nonparametric Mann–Whitney rank-sum test was used in (g, h) (nsp > 0.05; ***p < 0.0001). i–l Vpx(+) MDMs were infected with INsfGFP labeled VSV-G pseudotyped HIV-1 at MOI of 2 in the presence of EdU (5 μM). Infections were carried out in the presence of PF74 (2.5 μM), Nevi (10 μM), or RAL (10 μM) fixed at 72 hpi, and stained for CDK9/pS175, EdU/vDNA, and transcribed vRNA. i Images of an MDM nucleus showing INsfGFP (green), EdU (red), CDK9/pS175 (blue), and vRNA (white) spots. IN clusters are marked by dashed circles. White arrows point to IN clusters colocalized with EdU and vRNA spots; a yellow arrow shows colocalization of a single IN cluster with all three markers, including CDK9/pS175. Quantification of the number of nuclear IN (j), nuclear EdU (k), and vRNA puncta (l) is shown. Scale bar in (i) is 5 μm. Error bars in (j–l) are mean values ± SEM for >90 nuclei from three donors. The p values relative to DMSO are shown in blue (j–l) and relative to background (BG) RNA spots detected by RNAscope in noninfected MDMs are in black (l) (dashed blue line) was determined by two-tailed Student’s t test (nsp > 0.05; **p < 0.01; *** p <0.001). Source data are provided as a Source Data file.

