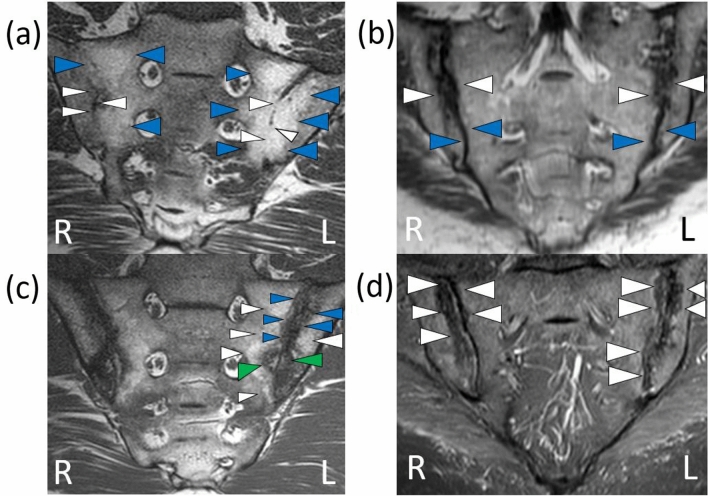
Figure 2.
Findings compatible with chronic sacroiliitis on MRI of the sacroiliac joints. Source: the authors (2019). Coronal T1 sequence: bilateral reduction of the intra-articular space in the sacroiliac joints consistent with bone bridges (white arrows), and bilateral high signal intensity suggestive of fat metaplasia (blue arrows) (a). Coronal T1 sequence: low signal intensity bilaterally consistent with bone erosion (white arrows) and bone sclerosis (blue arrows) (b). Coronal T1 sequence: on the left high signal intensity consistent with fat metaplasia (white arrows) and low signal intensity suggestive of bone erosion (green arrows) and bone sclerosis (blue arrows); similar findings on the right, with lower signal intensity (c). Coronal STIR sequence: low signal intensity bilaterally consistent with bone erosion (white arrows) (d). R: right side , L: left side.

