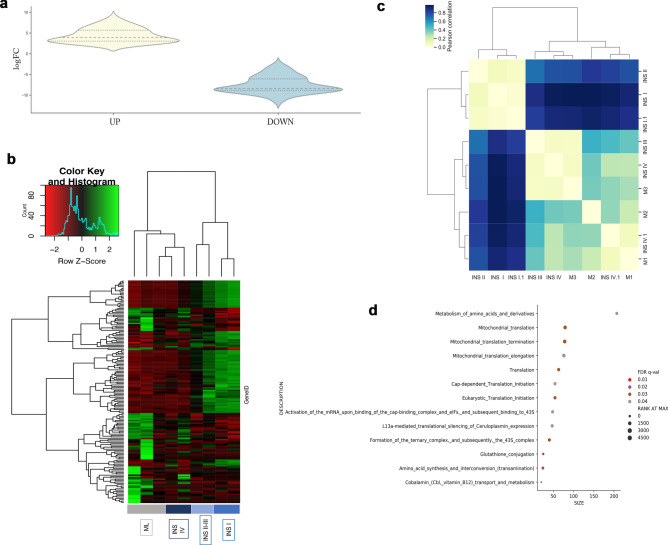
Figure 3.
Differential gene expression (DEG) and Reactome pathways analysis between primary insulinoma (INS) tissues and INS-metastatic lymph node tissue. Violin chart plot (A) based on log2FC display the DEG highlighting the set of altered genes and the distribution in the up and down set with log2FC < − 2 and > 2. Based on the 164 differentially expressed genes primary INS and metastatic lymph nodes were clustered using heatmap2 function (B) and matrix correlation (C). Reactome analysis of the enriched function according to Gene set enrichment analysis shows the enriched pathways in the downregulated (D) set selected based on the False discovery rate (FDR < 0.05), where the size represents the number of genes in the pathway and the Rank at Max shows the presence of these genes between the top up- or downregulated. Patients’ stage is described in Supplementary Table 1.

