Figure 1.

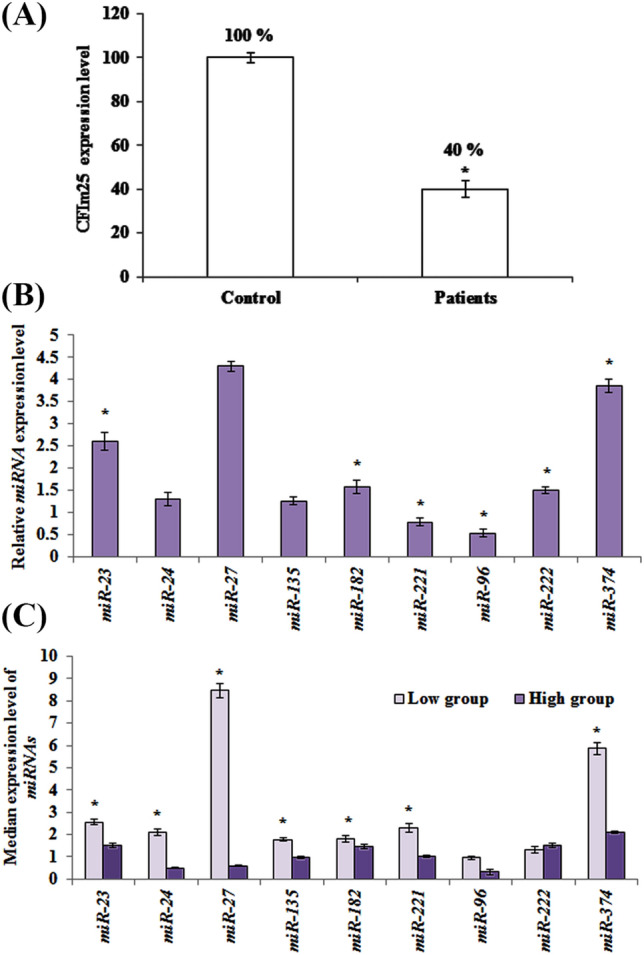
Comparative expression of CFIm25 vs involved miRNAs. (a) CFIm25 expression level in samples acquired from breast cancer patients and control group. CFIm25 is significantly lower in patients compared to controls. (b) Relative gene expression of miRNAs in patients. (c) Distribution of miRNA expression in patients according to low and high expression levels of CFIm25. Patients categorized as low or high CFIm25‑expressing tumors, using median expression of CFIm25 in normal samples as a cut-off. Data represent mean of at least three independent experiments. The star above the bars, represents significant difference respect to the corresponding control reference. The results are relative gene expression after normalization with β-actin for CFIm25 and SNORD47 for miRNA genes, using 2−ΔΔCt method.
