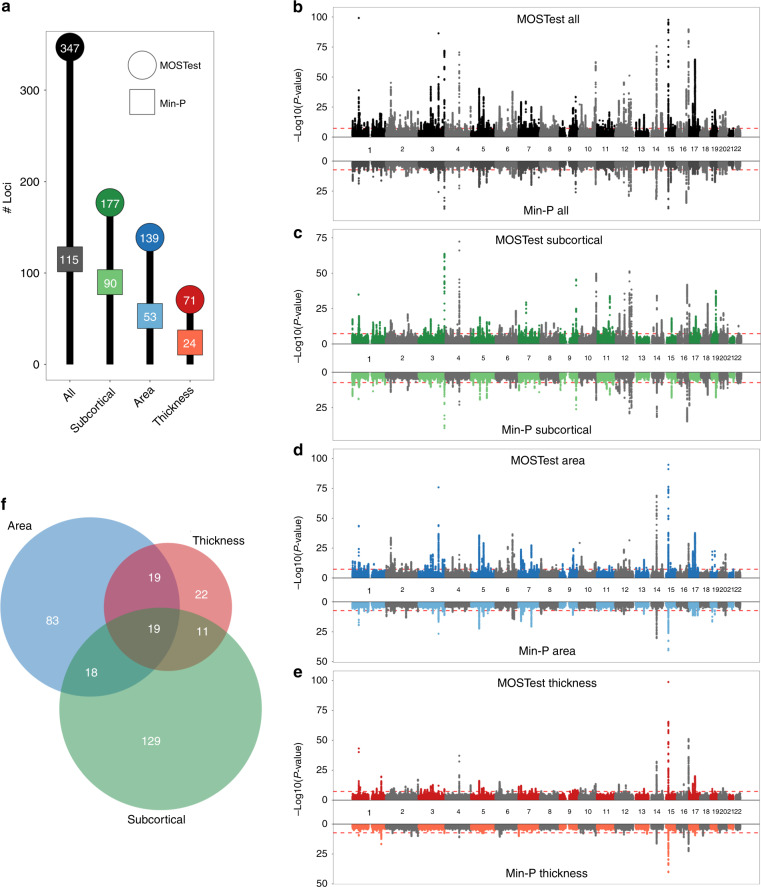
Fig. 1. MOSTest improves locus discovery.
a Number of independent genome-wide significant loci identified (on the y axis and in the bubbles) for each set of features (on the x axis), by MOSTest (in darker colored circles) and by min-P (in lighter colored squares). b–e Miami plots, contrasting the observed −log10(p-values), shown on the y axis, of each SNP for MOSTest (top half) with min-P (bottom half), for each of the feature sets. The x axis shows the relative genomic location, grouped by chromosome, and the red dashed lines indicate the genome-wide significance threshold of 5 × 10⁻⁸. Note, y axis is clipped at −log10(p-value) = 100. f Venn diagram depicting the number of loci, identified with MOSTest, overlapping between the three feature subsets.

