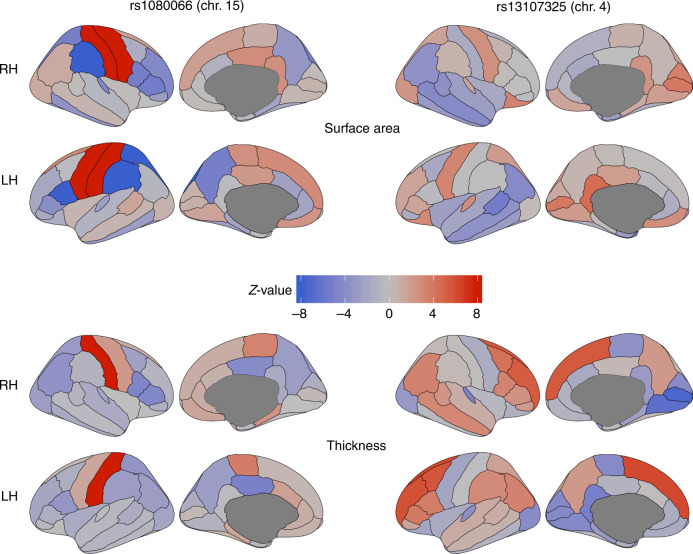
Fig. 3. The genetic variants identified with MOSTest have distributed effects across the cortex.
Z-values from the univariate GWAS for each cortical region for the two most significant lead SNPs from MOSTest applied to all features combined (left two columns for rs1080066 on chromosome 15, and right two columns for rs13107325 on chromosome 4). The top two rows show the effects of the SNPs on regional surface area, and the bottom two on cortical thickness. Positive effects of carrying the minor allele are shown in red, and negative in blue. Note: the absolute Z-value scaling is clipped at 8 (p = 1.2 × 10⁻¹⁵); an absolute Z-value of 5.45 corresponds to two-tailed genome-wide significance (p = 5 × 10⁻⁸). RH = right hemisphere, LH = left hemisphere.

