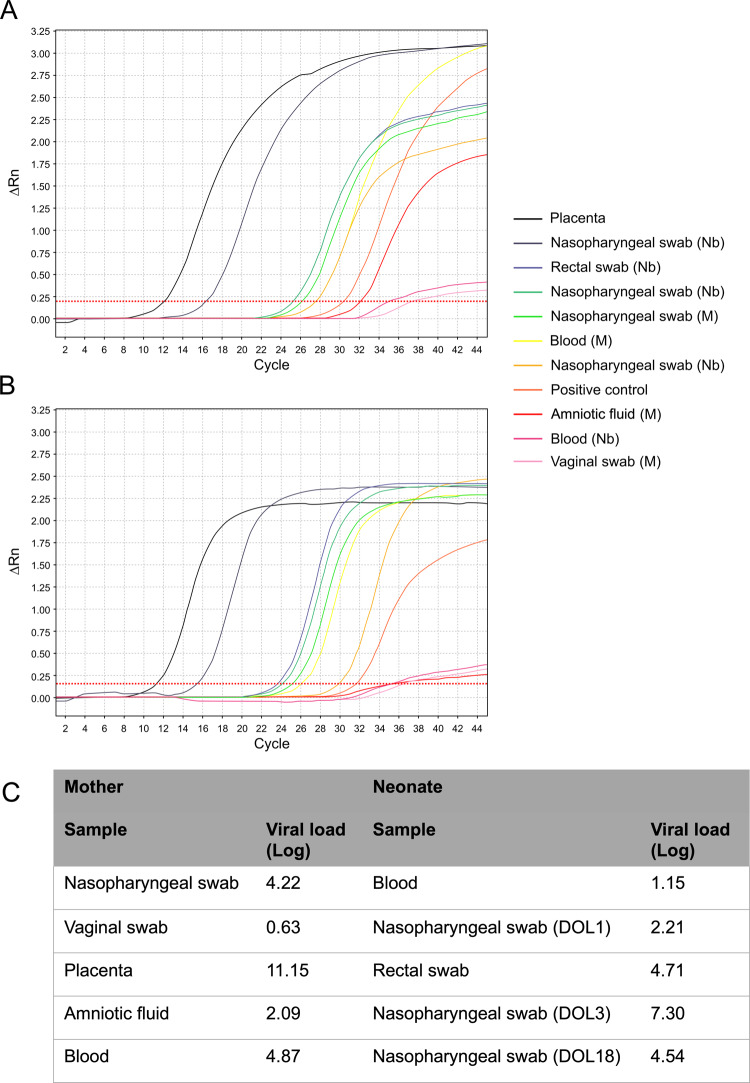
Fig. 3. Real-time polymerase chain reaction results.
a, b The E and S genes of SARS-CoV-2, respectively, for maternal and neonatal samples (X and Y axes represent the amount of amplified RNA and the number of cycles, respectively; the earlier the signal is detected, the lowest is the number of cycles and the higher the viral load is). c The viral load for each sample (expressed as Log copies/million of cells for the placenta and as Log copies/mL for all other specimens). All maternal samples were obtained right before the delivery or during C-section; newborn samples are listed chronologically and were obtained from the first to the third day of life, except for the last nasopharyngeal swab (obtained at 18 days of postnatal age). Colored lines represent the results of RT-PCR assay for each sample. The deep orange line represents the positive control, which is a SARS-CoV-2 culture supernatant (more details in “Methods”). Nasopharyngeal swabs at 1, 3 and 18 day of life are represented by the light orange, gray and green curves, respectively. Viral load in BAL fluidis not shown. DOL days of life, M maternal samples, Nb newborn samples.

