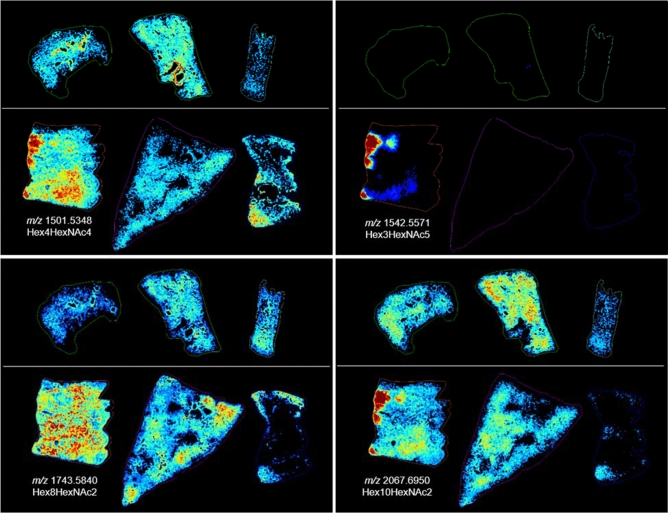
Figure 4.
Histology at 180 days post-exposure. Glycan images showing increases in relative intensity specific to distinct pathologies in the IR lungs (bottom images in each panel) compared to the control samples (top images in each panel). Top images in each panel are control, animal ID numbers as shown left to right: 0147, 0879, 08094011. Bottom images in each panel are IR, animal ID numbers as shown left to right: 04923, R03007, 040087. Changes were more pronounced in the sample from 04923, bottom left of each panel. Glycan structures were detected as the [M + Na] + ion and tentatively assigned. Hex = Hexose, dHex = fucose and HexNAc = N-acetylhexosamine.

