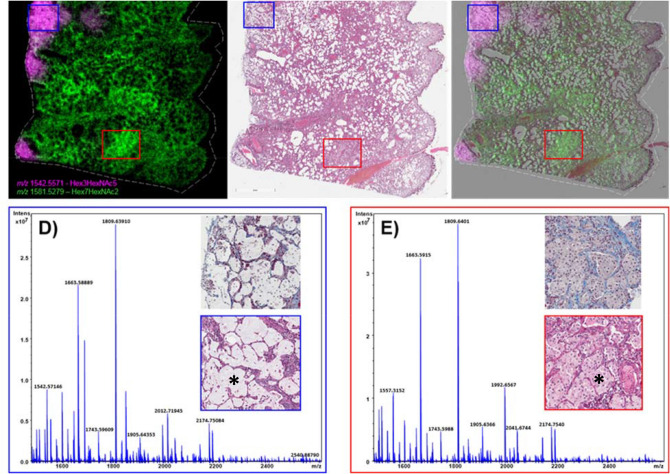
Figure 5.
MSI and mass spectra at 180 days post-exposure. MALDI-MS merged image of two high mannose glycan structures, tentatively assigned as Hex3HexNac5 and Hex7HexNac2, showing differential distribution in a lung sample taken at 180 days post-radiation (from 04923) in (A). The H&E stained section is shown in (B) and the MSI overlaid with the H&E section is shown in (C). Single pixel spectra and higher magnification stained sections are shown for regions of mucin accumulation (D) and blue boxes, and regions of high accumulation of alveolar macrophages (E) and red boxes.

