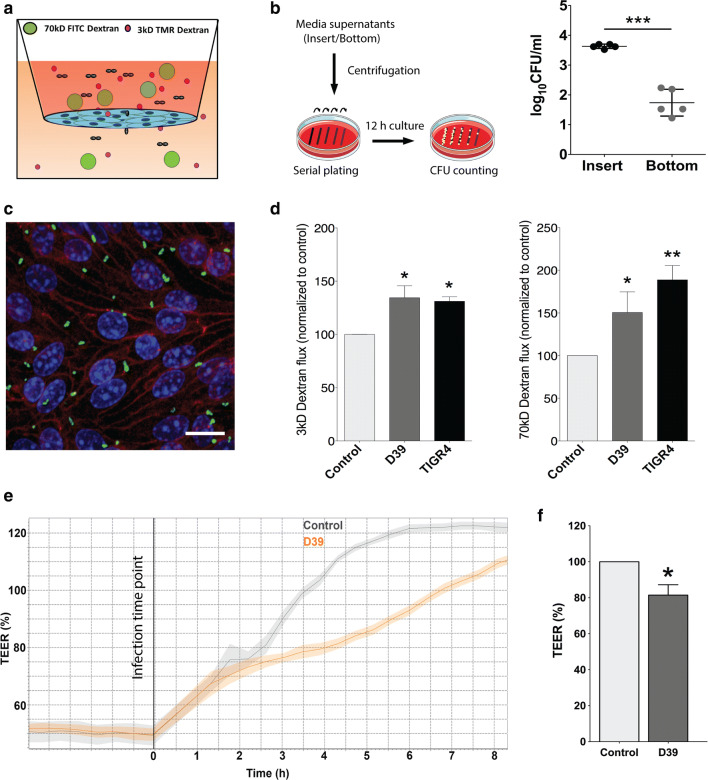
Fig. 3.
Bacterial transmigration and permeability upon S. pneumoniae infection in brain ECs. a The scheme depicts the in vitro model of the BBB for meningitis infection where bEnd5 cells were cultured in 24-well PET transwells (105 cells/cm2) and infected with S. pneumoniae (D39 and TIGR4 strain; MOI 50) along with the addition of labeled dextrans to the apical chamber (5 μM each of 3 kD TMR, and 70 kD FITC dextran). b Media supernatant from infected and control cells from the insert and the bottom well at 4 h post-infection were collected and centrifuged for plating and culture on blood agar plate. The colony forming unit (CFU) assay indicates transmigration of approximately 1% of the bacteria added to the insert (N = 5, ***p < 0.001, 2-tailed paired t test compared to control). c Confocal microscopy analysis of transwell inserts to confirm the presence of bacteria indicated predominant localization of the bacteria (green) at the cell–cell borders with VE-cadherin (red) serving as EC junction marker (representative from N = 3 experiments; scale bar 10 μm). d Permeability analysis of bEnd5 cells 4 h post-infection performed with low (3 kD) and high molecular weight (70 kD) dextrans shows a significant increase in dextran permeability for both sizes, confirming the breakdown of endothelial barrier due to infection (N = 5, *p < 0.05, **p < 0.01, 2-tailed paired t-test compared to control). e Representative graph for continuous transendothelial electrical resistance (TEER) values of S. pneumoniae (D39) infected bEnd5 cells on inserts using the cellZscope® system setting the values of the control group between 3–4 h post-infection to 100%. The graph shows reduced TEER values starting 3 h post-infection that persists for several hours indicating increase in paracellular permeability. The increase in the TEER values of the control group from the plateau at 0 h reflects the changes due to electrode handling and media composition. f Quantification at 4 h shows a significant reduction in TEER values in infected cells compared to control (N = 4, *p < 0.05, 2-tailed paired t test)

