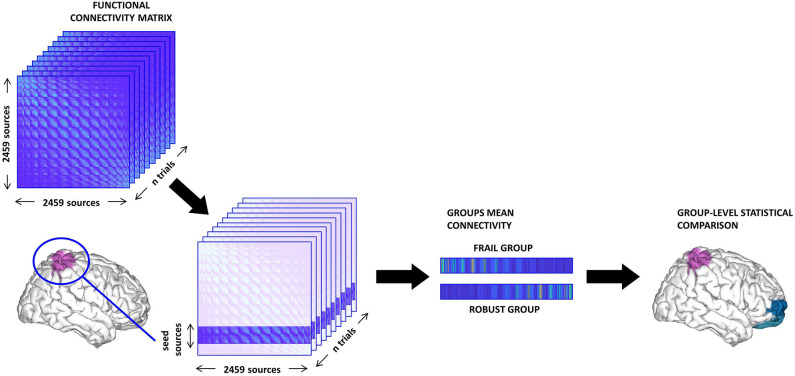
Figure 1.
Schema of the seed-based functional connectivity (FC) analysis. First, the sources belonging to the seed are selected from the FC matrix. Then, we compute the mean value of the FC between the seed and the rest of the brain (excluding intra-seed pairs) and average across trials thus obtaining one vector per subject. Finally, we perform group comparisons and correct for multiple comparisons using a cluster-based method.

