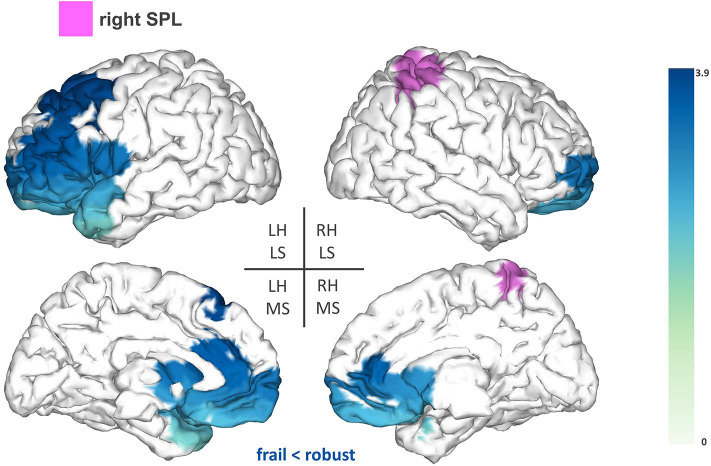
Figure 3.
Seed-based functional connectivity analysis results for the right superior parietal lobe (rSPL). The pink area represents the seed. The areas shaded in blue outline the clusters that are significantly hypoconnected to the rSPL in frail individuals when compared to robust participants. The blue colormap indicates hyposynchronization in the frail group between the seed and the cluster. The blue colorbar represents the t-statistic values of each source of the significant cluster obtained by independent samples t-test. RH, right hemisphere; LH, left hemisphere; LS, lateral surface; MS, medial surface.

