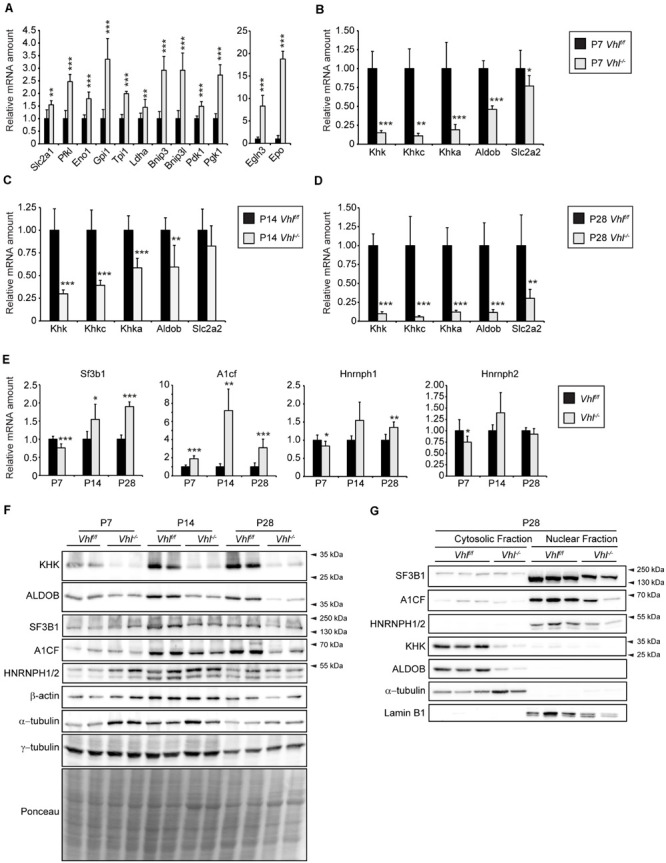
FIGURE 1.

Analysis of the fructolytic pathway in Vhl–/– livers. The fructolytic pathway was analyzed in P7, P14, and P28 Vhlf/f (control) and liver-specific Vhl–/– mice. (A,B) Expression of HIF-α target genes (A) and fructolytic genes (B) in P7 control and Vhl–/– livers. (C) Expression of fructolytic genes in P14 livers. (D) Expression of fructolytic genes in P28 livers. (E) Expression of splicing factors was analyzed in P7, P14, and P28 Vhlf/f (control) and liver-specific Vhl–/– mice (n = 5–7 mice). (F) Immunoblots of liver lysates. (G) Immunoblots of cytosolic and nuclear fractions from livers of P28 mice with antibodies against SF3B1, A1CF, HNRNPH1/2, KHK, ALDOB, and α-tubulin or Lamin B1 as loading controls. Each value represents the amount of mRNA relative to that in control mice, which was arbitrarily defined as 1. 18S rRNA and cyclophilin were used as the invariant control. Data are mean ± SD (n = 5–7 mice). Statistical analysis was performed using Student’s t-test or Student’s t-test with Welch’s correction. *p < 0.05; **p < 0.01; ***p < 0.001 vs. control mice.
