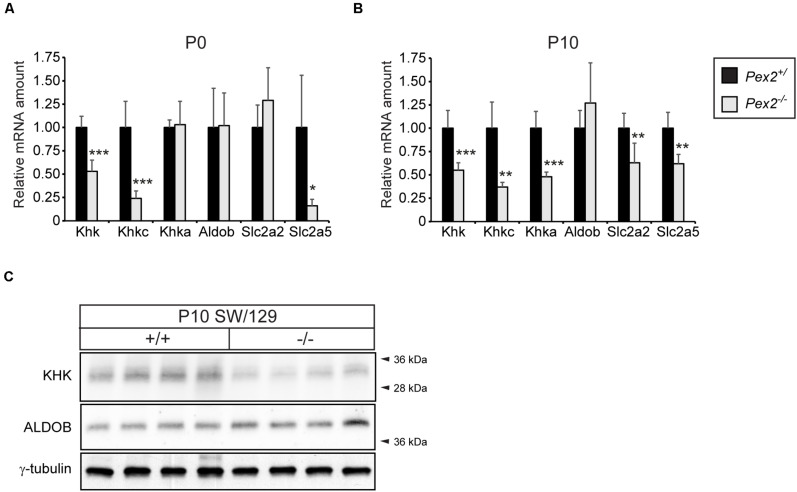
FIGURE 6.
Analysis of the fructolytic pathway in kidneys from control and Pex2–/– mice. (A) Expression of fructolytic genes in P0 control and Pex2–/– kidneys (n = 6 for control, n = 4 for Pex2–/– mice). (B) Expression of fructolytic genes in P10 control and Pex2–/– kidneys (n = 6 for control and Pex2–/– mice). (C) Immunoblots of P10 kidney lysates with antibodies against total KHK, ALDOB, and γ-tubulin as loading control. Each value represents the amount of mRNA relative to that in control mice, which was arbitrarily defined as 1. Cyclophilin was used as the invariant control. Data are mean ± SD. Statistical analysis was performed using Student’s t-test or Student’s t-test with Welch’s correction. *p < 0.05; **p < 0.01; ***p < 0.001 vs. control mice.

