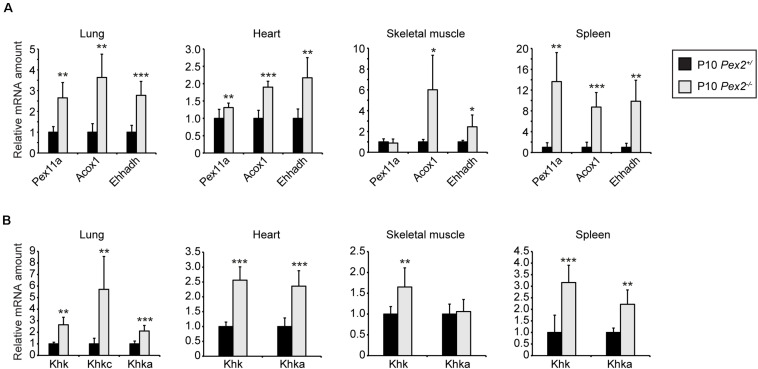
FIGURE 8.
Expression of fructolytic genes in lung, heart, skeletal muscle, and spleen from control and Pex2–/– mice. (A,B) Expression of PPARα target (A) and fructolytic genes (B) in P10 control and Pex2–/– tissues (n = 6 for control and Pex2–/– mice). Each value represents the amount of mRNA relative to that in control mice, which was arbitrarily defined as 1. Cyclophilin was used as the invariant control. Data are mean ± SD (n = 6 for control and Pex2–/– mice). Statistical analysis was performed using Student’s t-test or Student’s t-test with Welch’s correction. *p < 0.05; **p < 0.01; ***p < 0.001 vs. control mice.

