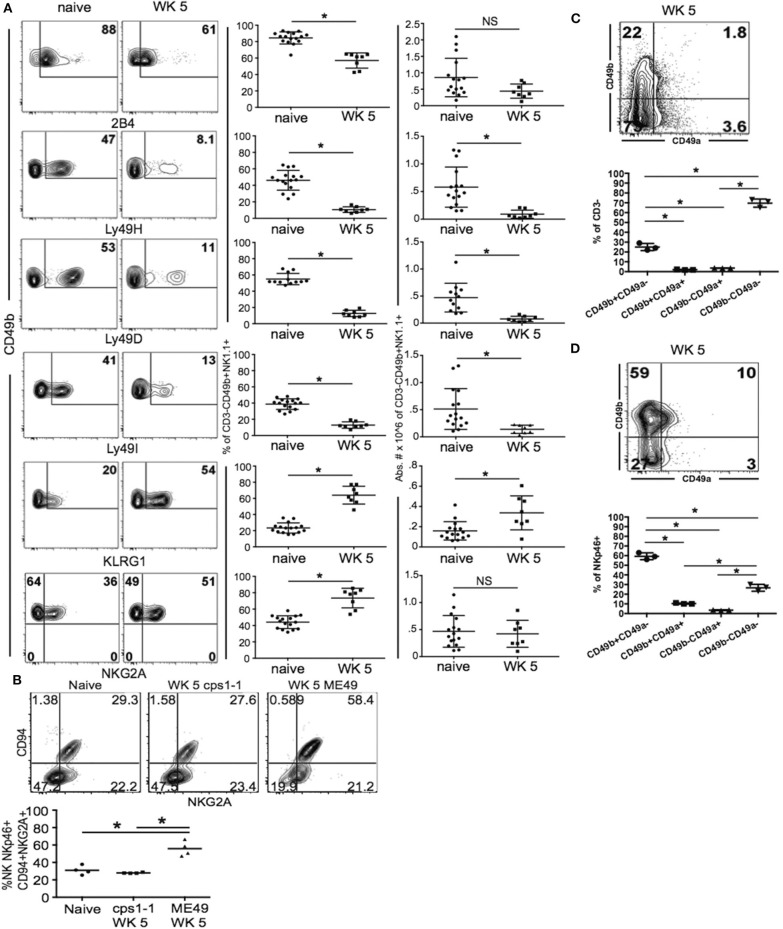
Figure 5.
NKp46+NKG2A+KLRG1+ NK cells are enriched in spleen during chronic T. gondii infection. C57BL/6 mice were orally infected with 10 cysts of ME49 and analyzed for the NK cell receptors 2B4, Ly49H, Ly49D, Ly49I, KLRG1, CD94, and NKG2A by flow cytometry. (A) Contour plots present the frequency of CD49b+ × receptor + cells comparing naïve animals to week 5 post infection. Graphs show pooled data from 3 experiments of frequency and absolute number of CD49b+ Receptor+ cells. (B) Mice were infected with either 1 × 10⁶ tachyzoites of csp1-1 i.p. or 10 cysts ME49 i.g. At week 5 post infection, lineage-CD49b+NKp46+ cells were analyzed for CD94 × NKG2A. Contour plots present data from one experiment showing frequency of CD94 × NKG2A cell populations. The graph presents data from 1 experiment comparing the frequency of CD94+NKG2A+ cells between naïve, cps1-1 and ME49 mice. (C) Mice were infected with 10 cysts of ME49 i.p. then spleen cells were analyzed at week 5 post infection for CD49a × CD49b to identify ILC1 compared to NK cells. Contour plot presents the frequency of CD49a × CD49b cells in the CD3– population. (D) Contour plot presents the frequency of CD49a × CD49b cells in the CD3–NKp46+ population. (C,D) Graphs present the frequency of CD49b+CD49a–, CD49b+CD49a+, CD49b–CD49a+, and CD49b–CD49a–. All experiments were repeated independently a minimum of 2 times with n = 3–4 per group. *denotes significance with a p ≤ 0.05.

