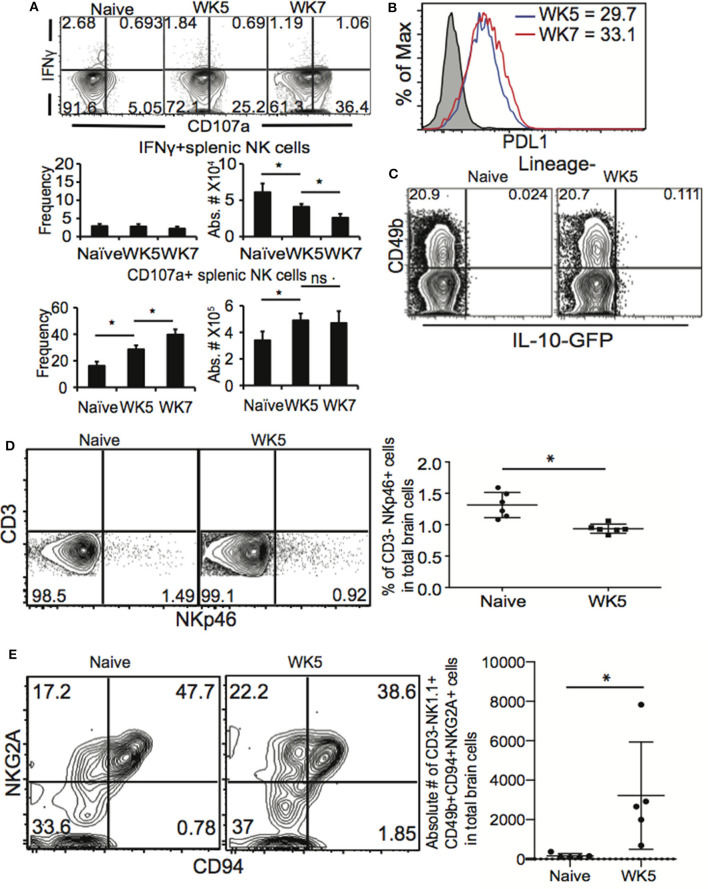
Figure 6.
NK cells have altered function during chronic T. gondii infection. C57BL/6 or IL-10 reporter TIGER-GFP mice were orally infected with 10 cysts of ME49 and 5 and/or 7 weeks after infection spleen cells analyzed for function. (A) Spleen cells were stimulated ex vivo with plate bound anti-NK1.1 then stained for NK cells (CD3–CD49b+ NKp46+) IFNγ and CD107a. Contour plots present frequency data gated on NK cells and compares IFNγ × CD107a. Graphs present the frequency and absolute number of IFNγ+ NK cells (top graphs) and CD107a+ NK cells (bottom graphs). Graphs present mean ± SD. (B) Splenic NK cells were assayed for PDL1 expression. Histogram presents the MFI of PD-L1 on NK cells from weeks 5 and 7 post infection mice. (C) Contour plots present the frequency of IL-10 GFP+ NK cells in naïve compared to week 5 post infection mice. (D) Brain cells were isolated and stained for lineage markers, CD49b and NKp46. Contour plots present the frequency of CD3–NKp46+ cells in the CNS. Graphs present the pooled data from 2 experiments of frequency of CD3–NKp46+ cells in the CNS with n = 3 mice per group. (E) Brain cells form naïve and WK5 infected mice were stained for CD3–CD49b+NK1.1+CD94+NKG2A+ cells. Contour plots present representative data from 1 experiment repeated 2 times with n = 5 mice per group showing CD3–CD49b+NK1.1+ cells analyzed for the frequency of CD94 and NKG2A+ cells. The graph presents absolute numbers of CD94+NKG2A+ cells in total NK cells from brains. Significance is denoted by *with a p ≤ 0.05.

