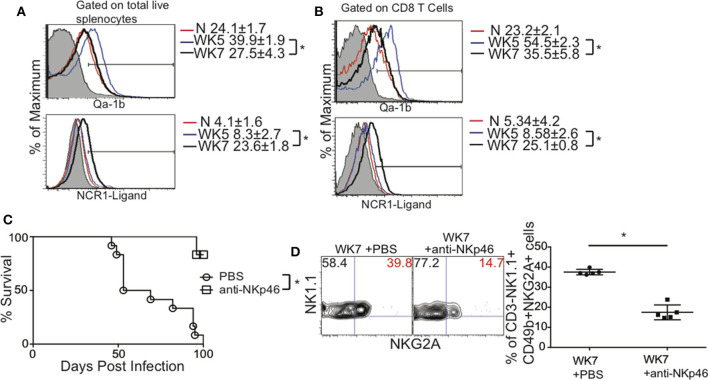
Figure 7.
Blockade of NKp46 rescues mice from death caused by CD8+ T cell exhaustion induced parasite reactivation. C57BL/6 mice were orally infected as above and total splenocytes were assayed for NKG2A ligand Qa-1b and NKp46 ligand using soluble NCR1 fused to human Ig Fc. (A) Histograms present the MFI ± SD of QA-1b (top) and NCR1-ligand (bottom) from total splenocytes. (B) Histograms present the MFI ± SD of QA-1b (top) and NCR1-ligand (bottom) from CD8+ T cells. (C) Mice were infected with 10 cysts of ME49 i.g. and treated with 50 μg of anti-NKp46 or 1 X PBS i.p. starting at week 5 p.i. Mice were treated every other day for the duration of this experiment. The survival graph presents pooled data from 3 independent experiments with n = 4–5 mice per group. The log-rank (Mantel-Cox) test was used to evaluate survival rates. (D) Mice were infected with 10 cysts of ME49 i.g. and treated with 50 μg of anti-NKp46 or 1 X PBS i.p. starting at week 5 p.i. Mice were treated every other day for the duration of this experiment and harvested 2 weeks after start of treatment. The frequency of CD3–NK1.1+CD49b+NKG2A+ NK cells was measured in the spleen. Contour plots and graph present frequency of NK1.1+NKG2A+ spleen cells from 1 experiment repeated independently twice with n = 5 mice per group. *denotes significance with p ≤ 0.05.

