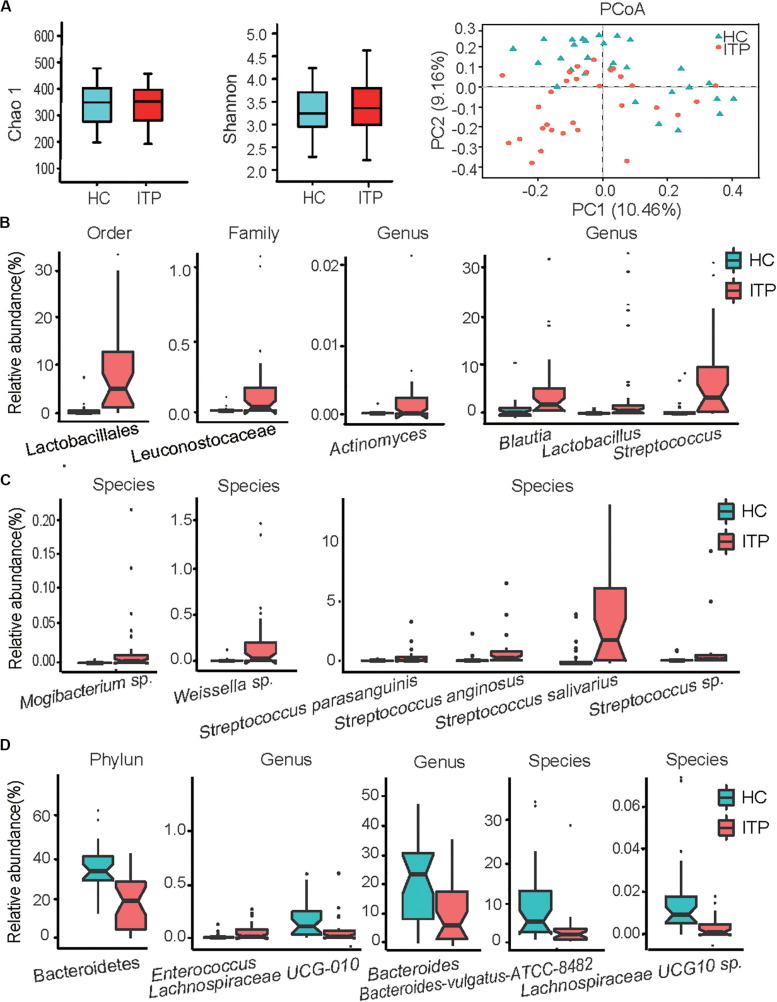
FIGURE 1.
Alterations of gut microbiota in patients with primary immune thrombocytopenia (ITP) vs healthy controls (HCs). (A) Box plot of the Chao1 index, Shannon index and a two-dimensional plot of principal co-ordinates analysis built based on a bray matrix of the two groups. (B) Bacterial order, family, and genera enriched in feces of ITP patients. (C) Species enriched in ITP patients. (D) Phylum, genera and species depleted in ITP patients. The boxes represent the interquartile range, from the first and third quartiles, and the median is shown as a thick line in the middle of the box. The circles represent outliers beyond the whiskers. Each point in the graph represents a sample, and a color indicates a group of samples. pajust < 0.05 for all data selected.

