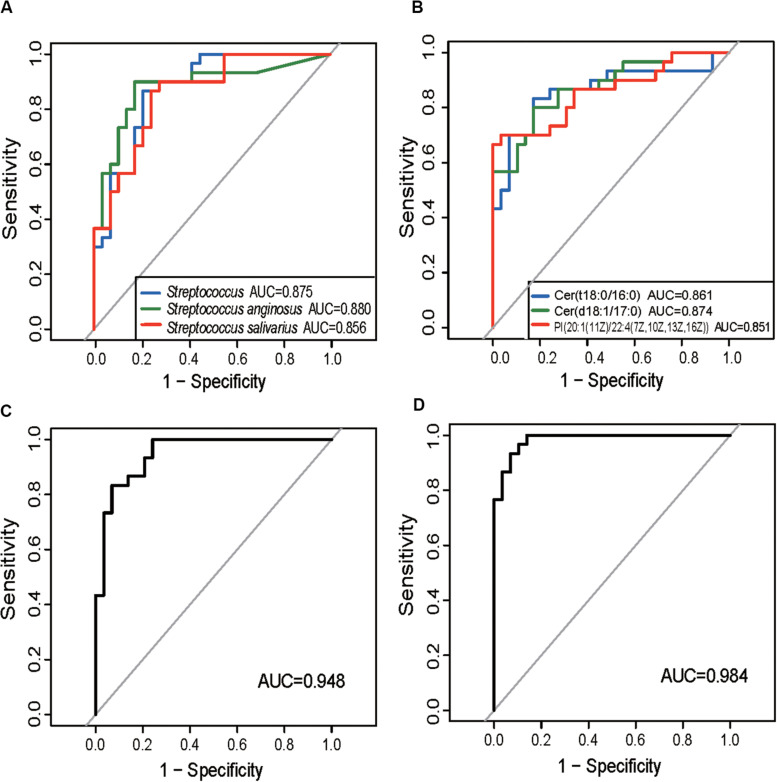
FIGURE 3.
Prediction of ITP-enriched bacteria and metabolites. (A) Receiver-operating characteristic (ROC) plot for Streptococcus, Streptococcus anginosus and Streptococcus salivarius, areas under the parametric curve (AUC) value are 0.875, 0.880, and 0.856, respectively. (B) ROC plot for Cer (t18:0/16:0), Cer (d18:1/17:0), and PI [20:1(11Z)/22:4(7Z,10Z,13Z,16Z)], AUC are 0.861, 0.874, and 0.850, respectively. (C,D) The ROC analysis of the combination of Weissella and Streptococcus anginosus, or Cer (t18:0/16:0), Cer (d18:1/17:0), and 13-hydroxyoctadecanoic acid, with their corresponding AUC reaching 0.948 and 0.984, respectively.

