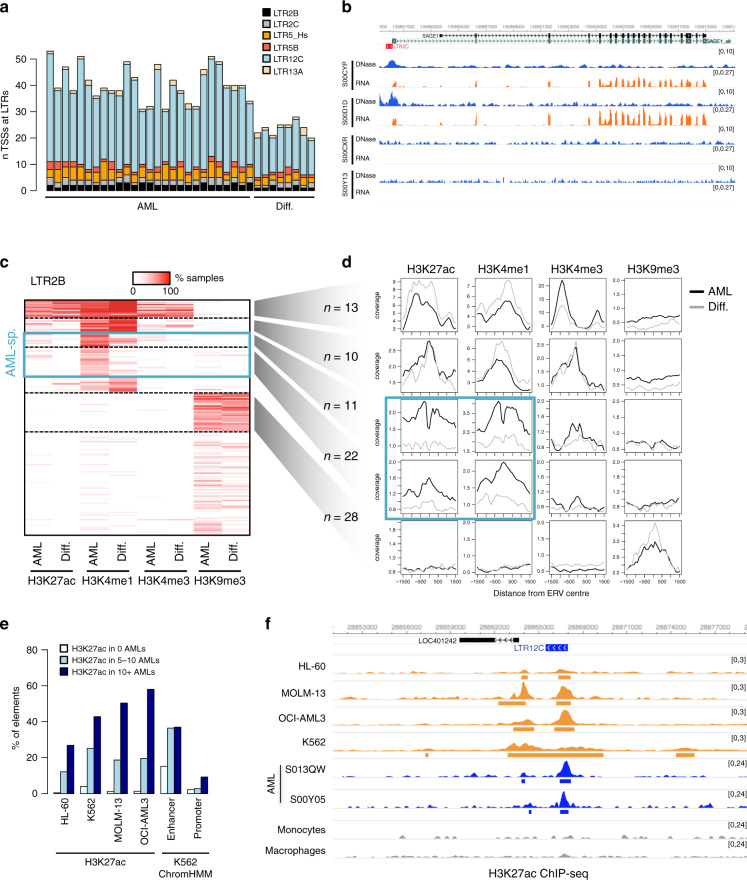
Fig. 2. A-DARs bear signatures of enhancer elements.
a Number of transcriptional start sites of spliced transcripts that overlap with A-DAR elements in AML or differentiated myeloid cells. b Example of a LTR12C element that generates an alternative promoter that drives the expression of SAGE1 in AML samples where this element is active. c Heatmap of overlap between LTR2B elements and histone modification peaks. Colour intensity represents the percentage of AML or differentiated cell samples where overlap is observed. Dashed lines segregate clusters identified by k-means clustering. d Average ChIP-seq profiles for LTR2B elements within specific clusters defined in (c). Blue boxes highlight two clusters where H3K4me1 and H3K27ac levels are higher in AML compared with differentiated cells. e Percentage of A-DAR elements that overlap H3K27ac peaks in different cell lines, or that are classified as enhancers or promoters in ChromHMM data from K562 cells. A-DAR elements were subdivided according to the number of AML samples displaying overlap with H3K27ac. f Example of a LTR13A element where cell lines reproduce the AML-specific H3K27ac marking observed in AML samples. Peaks called by MACS2 are depicted underneath each track.

