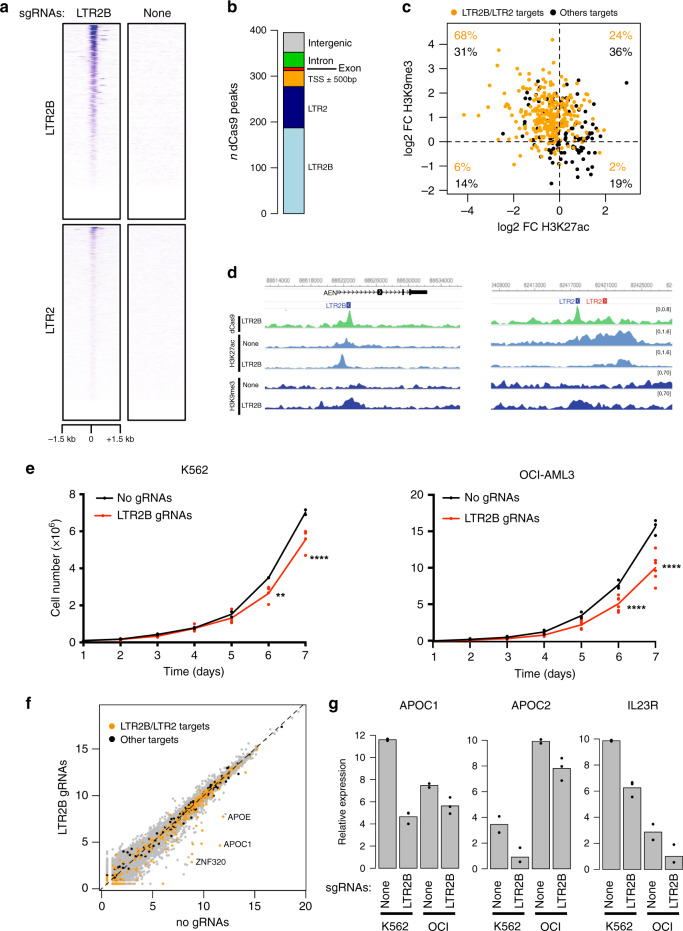
Fig. 5. CRISPRi of LTR2B/LTR2 elements leads to impaired cell growth.
a Profile of dCas9 ChIP-seq signal over LTR2B and LTR2 elements in K562 cells expressing LTR2B sgRNAs or an empty vector (“None”). b Number of dCas9 peaks overlapping LTR2 and LTR2B elements, or other genomic features. c Log2 ratio of the ChIP-seq signal at dCas9 peaks (1 kb regions from the centre of each peak) between K562 cells expressing LTR2B sgRNAs or empty vector. Orange points highlight dCas9 peaks overlapping LTR2B or LTR2 elements. d Two examples of LTR2B/LTR2 elements targeted by dCas9, showing decreased H3K27ac and increased H3K9me3. e Cell proliferation assay in K562 (left) and OCI-AML3 (right) cells expressing LTR2B sgRNAs or an empty vector. Data are from 2 (K562) or 3 (OCI-AML3) independent assay replicates (performed at least 5 days apart) from either one (no gRNA) or two different infections (LTR2B gRNAs). **p = 0.0096 and ****p < 0.0001 (two-way ANOVA with Sidak′s multiple-comparison test). Source data are provided as a Source Data file. f Gene expression levels in K562 cells expressing LTR2B sgRNAs or empty vector. Orange points highlight genes within 50 kb of a dCas9 peak targeting LTR2B/LTR2 elements; black points refer to genes within 50 kb of other dCas9 peaks. g Comparison of expression changes at selected genes between K562 and OCI-AML3 (“OCI”) CRISPRi cells (n = 3 biological replicates).

