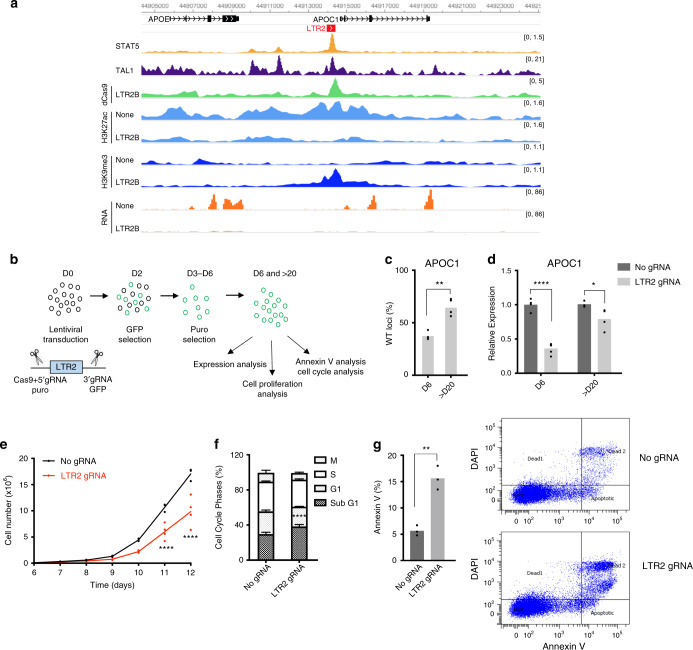
Fig. 6. APOC1-LTR2 element promotes cell proliferation.
a Genome browser snapshot for APOC1-LTR2 element, showing TAL1, STAT5 ChIP-seq tracks for WT, H3K27ac, H3K9me3 ChIP-seq and RNA-seq tracks for no control and CRISPRi K562 cells. b Schematic of the experimental design to genetically excise APOC1-LTR2 element. c qPCR data from cells with APOC1-LTR2 excision (n = 3 (D6) and n = 4 (>D20) biological replicates, bars represent mean value; two-tailed t test denotes **p = 0.0036). d Expression data in the APOC1-LTR2 excision cells (n = 4 (D6) and n = 3 (>D20) biological replicates, bars represent mean value; two-way ANOVA with Tukey′s multiple-comparison test, *p = 0.0312 and ****p < 0.0001). e Cell proliferation assay of control and APOC1-LTR2-excised cells after puromycin selection (day 6). Data are from three independent experiments, one of which used two different APOC1-LTR2 gRNA sets. ****p < 0.0001 (two-way ANOVA with Sidak’s multiple-comparison test). f Cell cycle profiles of control and APOC1-LTR2-excised cells. Data are represented as mean ± SD (n = 3 biological replicates, two-way ANOVA with Sidak’s multiple-comparison test, ****p < 0.0001). g % of Annexin V-stained cells in K562 cells upon APOC1-LTR2 excision (left, n = 3 biological replicates, two-tailed t test, **p = 0.0022). Representative flow cytometry analysis of Annexin V (right). Source data are provided as a Source Data file for (c–g).

