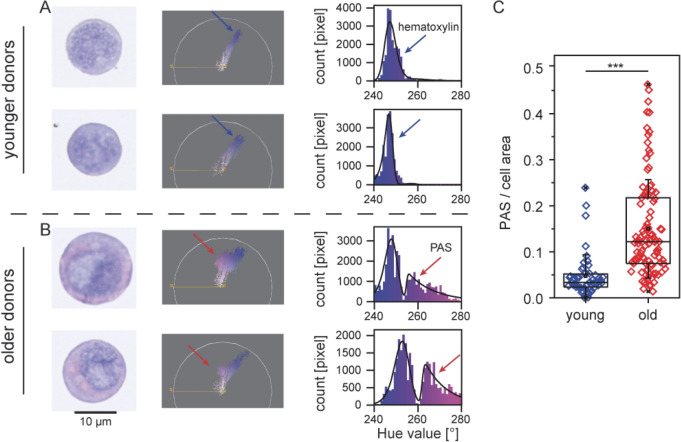
Figure 1.
Semi-quantitative assessment of intensity of PAS reaction. (A) Example from a subject age < 35 years, (B) example from a subject > 50 years, arrows indicating signal from PAS and hematoxylin stained areas. (C) Results of the analysis in 6 human subjects, 3 younger (< 35 years) and 3 older (> 50 years). In subjects > 50 years, the average glycogen content was significantly higher than that found in human subjects < 35 years. The difference is statistically significant (one sided t-test, p = 1.2 × 10⁻⁶, N ≥ 15 CD34+ cells for each individual subject. Software: Fiji plug-in Color Inspector 3D.

