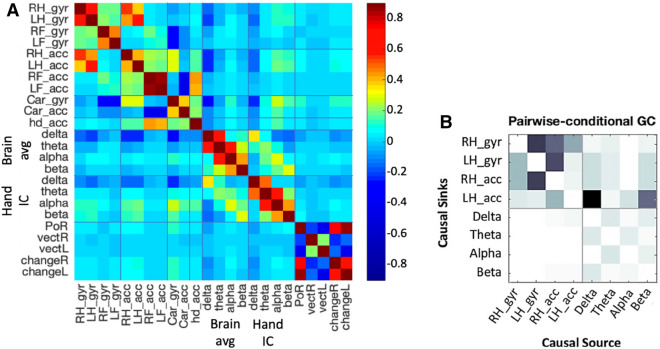
Figure 4.
Global assessments: (A) Instantaneous correlation matrix between all data groups: gyroscope rotation (gyr) and acceleration (acc) of the right and left hands (RH,LH), the right and left feet (RF,LF), the car (Car), and the head (hd); the band power in the delta, theta, alpha, and beta bands across the brain (Brain avg) and in the left motor cortex (Hand IC); eye gaze point of regard (PoR), the gaze vectors (vect) and the change in gaze vector (change) for the right (R) and the left (L) eye; (B) Granger causality pairwise results considering the data groups separated by grey lines. Darker colour is associated with more robust causality, for which brain data is more cause of hand movements than the other way around. A significance of p=0.05 and Bonferroni correction supported these conclusions.

