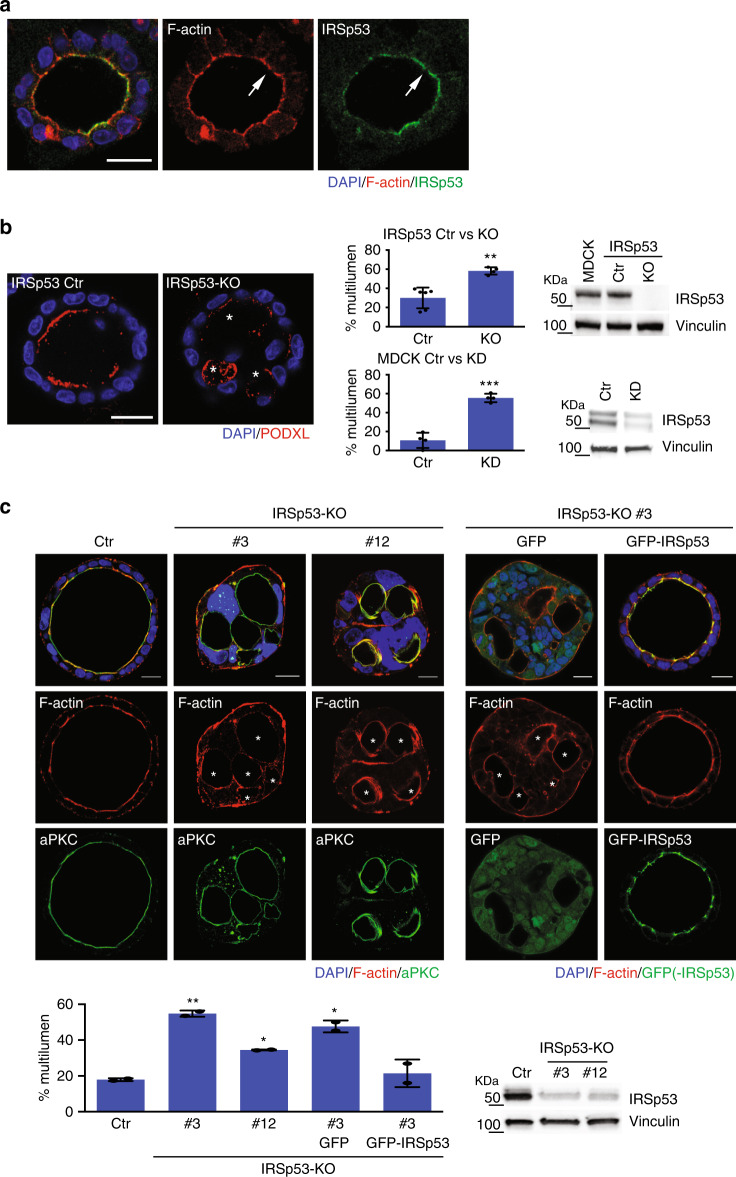
Fig. 2. IRSp53 removal increased the formation of cysts with multiple lumens.
a Three days old MDCK epithelial cysts were fixed and stained an anti-IRSp53 antibody (green), and rhodamine phalloidin (red) to visualized F-actin and DAPI (blue). Arrows indicate IRSp53 and F-actin at the luminal side of the cyst. Scale bar, 18 µm. b Five days old 3D cysts of MDCK control cells (IRSp53 Ctr) or IRSp53-KO obtained by CRISPR/Cas9, or MDCK control (MDCK Ctr) or IRSp53-KD (not shown). Left: the cysts were stained with anti-podocalyxin (PODXL, red) and DAPI (blue). Asterisks, multiple lumens in IRSp53-KO cyst. Scale bar, 18 µm. Central: quantification of cysts with multiple lumens in IRSp53 Ctr vs IRSp53-KO (Top) or IRSp53 Ctr vs IRSp53-KD (Bottom). Data are expressed as means ± SD. At least 20 cysts/experiment were analysed in n = 6 (IRSp53 Ctr), n = 4 (IRSp53-KO) or n = 4 (IRSp53 Ctr and IRSp53-KD) independent experiments. P value, student’s t-test two-tailed. **p < 0.01; ***p < 0.001. Source data are provided as a Source Data file. Right: IRSp53 and vinculin protein levels. Mw Molecular weight markers. c Top left: 3D cysts embedded into Matrigel/ collagen matrix of Caco-2 control (Ctr) or IRSp53-KO clones #3 and #12 cells, obtained by CRISPR/Cas9 were stained with an anti-atypical-PKC antibody (a-PKC, green), rhodamine-phalloidin to detect F-actin (red) and DAPI (blue). Asterisks, multi-lumens in IRSp53-KO cyst. Scale bar, 10 µm. Top right: 3D cysts from IRSp53-KO clone #3 stably-infected to express GFP or murine GFP-IRSp53 cells were processed for epifluorescence to visualize GFP or GFP-IRSp53 and stained with rhodamine-phalloidin to detect F-actin (red) and DAPI (blue). Asterisks, multiple lumens in IRSp53-KO GFP cyst. Scale bar, 10 µm. Lower left: Quantification of cysts with multiple lumens. Data are expressed as mean ± SD. At least 25 cysts/experiment were analysed in n = 2 independent experiments. P value, student’s t-test two-tailed. *p < 0.05; **p < 0.01. Source data are provided as a Source Data file. Lower right: IRSp53 and vinculin protein levels (for GFP and GFP-IRSp53 levels-Supplementary Fig. S5A). Residual expression of IRSp53 in clones #3 and #12 is due to the aneuploidy of Caco-2 cells (see “Methods”).

