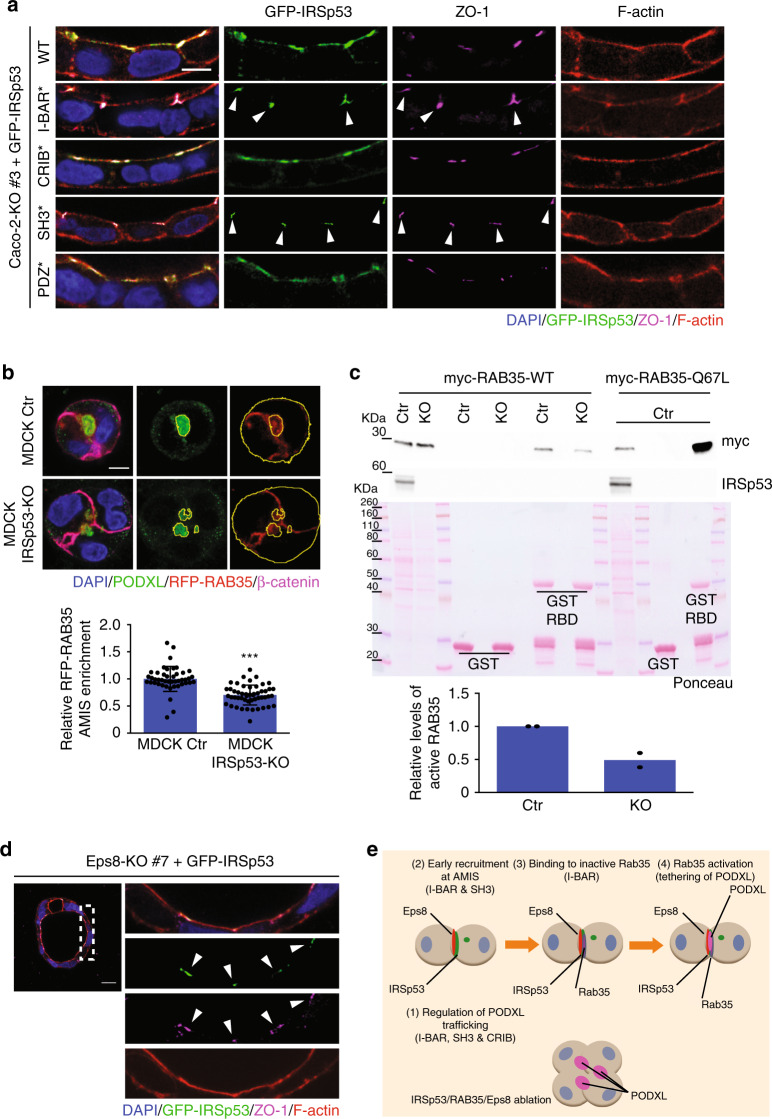
Fig. 6. Membrane- and SH3-mediated interactions guide IRSp53 localization.
a Seven days-old 3D cysts from Caco-2 IRSp53-KO #3 cells stably infected with murine GFP-IRSp53 WT, I-BAR*, CRIB*, SH3*, PDZ* were processed to visualize GFP-IRSp53 (green) and stained with an anti-ZO-1 antibody (magenta), rhodamine-phalloidin to detect F-actin (red), and DAPI (blue). Arrowheads indicate IRSp53 I-BAR* and SH3* at ZO-1-junctions. Scale bar, 10 µm. b Top: 1 day-old 3D cysts from MDCK wild-type control (Ctr) or IRSp53-KO cells stably expressing RFP-RAB35 were processed to visualize RFP-RAB35 (red), stained with anti-PODXL (green) and anti-β-catenin (magenta) antibodies, and DAPI (blue). PODXL and RFP-RAB35 signals were analysed using masks (in yellow) to quantify RFP-RAB35 localization at the AMIS. Bottom: Quantification of RFP-RAB35 at the AMIS expressed as the ratio of RFP-RAB35 at the AMIS/ RFP-RAB35 out of the AMIS. Data are means ± SD. At least 15 cysts/ experiment were analyzed in n = 2 independent experiments. P value, student’s t-test two-tailed. ***p < 0.001. Source data are provided as a Source Data file. Scale bar, 10 µm. c Top: Lysates of MDCK control (Ctr) or IRSp53-KO (KO) transfected with myc-RAB35-WT or MDCK wild type transfected with myc-RAB35-67L were subjected to in vitro pull down with 0.2 μM of recombinant purified GST-RBD or GST as control. Inputs and IVBs were analysed by Ponceau to detect GST or GST-RBD purified proteins, and subjected to Western blotting with the indicated antibodies. Bottom: RAB35 levels quantified using ImageJ software were expressed relative to the levels of active-GTP bound RAB35 in MDCK wild type samples. Data are means from n = 2 independent experiments. d Seven day-old 3D cysts from Caco-2 Eps8-KO #7 cells infected with murine GFP-IRSp53 wild-type were processed to visualize GFP-IRSp53 (green), stained with an anti-ZO-1 antibody (magenta), rhodamine-phalloidin to detect F-actin (red), and DAPI (blue). Right panels represent 4× magnification of the area depicted by the dashed square (Left). Arrowheads, re-localization and enrichment of IRSp53 at the ZO-1–labeled cell–cell junctions. Scale bar, 20 µm. e Schematic of the functional interactions of IRSp53 with RAB35 and EPS8 at the AMIS. The IRSp53 domains required for its localization and activity on PODXL trafficking.

