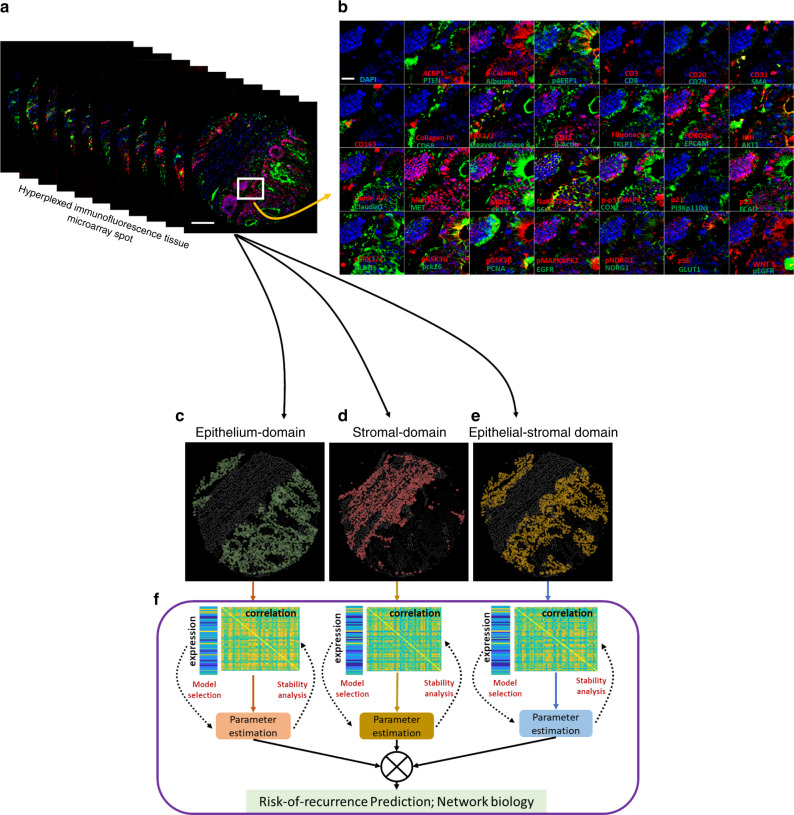
Fig. 1. Hyperplexed immunofluorescence imaging based spatial analytics (SpAn) platform.
a Hyperplexed image stack of a TMA spot generated by iteratively multiplexed (Fig. S2) HxIF imaging using the Cell DIVE platform19. Scale bar: 100 µm. b Close-up view of a TMA region in (a) outlined in white (~110 µm by 110 µm), labeled with 55 biomarkers (plus DAPI nuclear counterstain) that include epithelial, immune and stromal cell lineage, subcellular compartments, oncogenes, tumor suppressors, and post-translational protein modifications described in detail in Supplementary Table 1. Hyperplexed imaging is implemented via iterative label–image–dye-inactivation immunofluorescence cycle (see Methods and Fig. S2). Scale bar: 20 µm. c–e Dissection of the TMA spot into three spatial domains (epithelial, stromal, and epithelial-stromal domains) identified and segmented using structural biomarkers (see Methods and Fig. S3). f For each of the three spatial domains both expressions (scale range: 1 through 12 on a log2 scale) of the 55 biomarkers and their Kendall rank-correlations (scale range: −1 through +1) both within and across the cells together defined the domain-specific features. L1-norm based penalized Cox regression was used for model selection, while L2 penalty was used for final model parameter (coefficients) estimation. The stability of the model was tested at the 90% concordance level, and the parameters were reevaluated for final construction of the SpAn spatial model.

