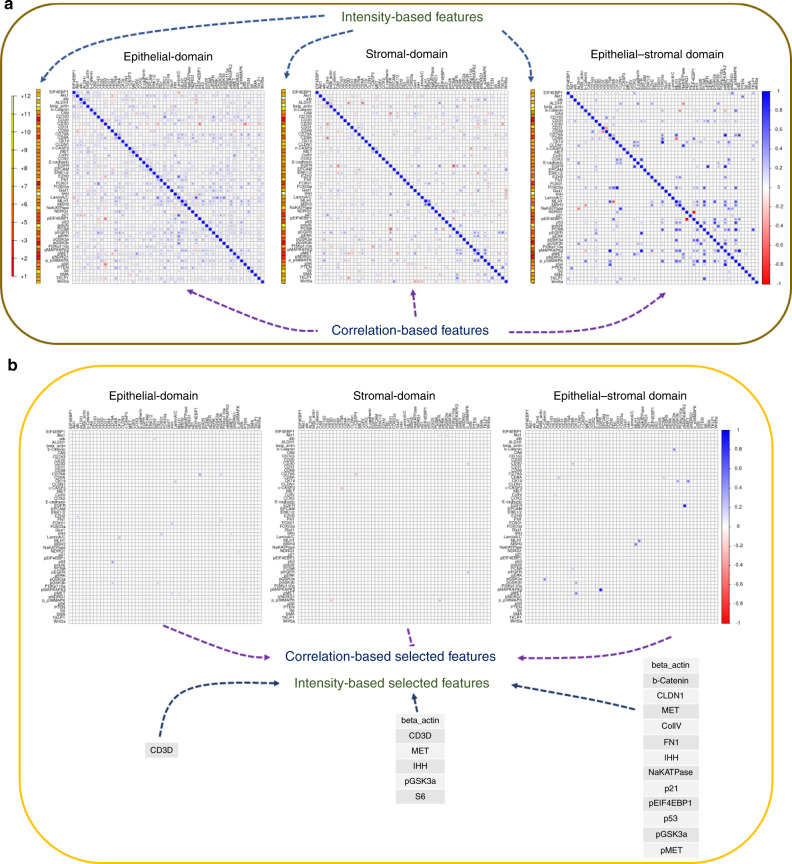
Fig. 2. SpAn domain-specific feature selection.
a Individual mean protein-expression intensity profile depicted as a vector and pairwise Kendall rank-correlations between protein expressions—visualized as a matrix for each of the three spatial domains. The protein expressions are shown in log scale. To prevent inclusion of false-positive protein expression, only intensities above the 85th percentile were considered as expressions and used to compute the correlations (see Methods). b Features, including both expressions and correlations, selected by SpAn based on L1-penalized Cox regression used for model selection. The selected features were consistently concordant at the 90% level with the recurrence outcome.

