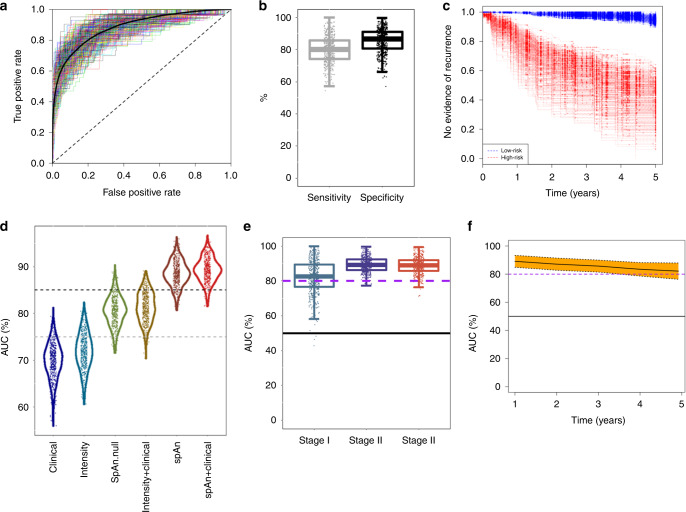
Fig. 4. Performance of SpAn in predicting 5-year CRC-recurrence risk.
a SpAn receiver operating characteristics (ROC) curves for predicting risk of 5-year CRC recurrence in patients with resected CRC primary tumor. The plot shows ROC curves, rendered in different colors for improved visual contrast, for 500 bootstrap runs with independent training and validation sets. Area under the mean ROC curve, shown as a black-solid curve, is 88.5% with a standard error of 0.1%. The black dashed 45-degree line indicates random guessing. b Boxplots of the sensitivity and specificity values for the same 500 bootstrap runs as in (a) with the operating point on the ROCs chosen by minimizing overall misdiagnosis rate. The mean sensitivity and specificity values, respectively, are 80.3% (standard error of 0.4%) and 85.1% (standard error of 0.3%). (Box plot center line: median value; box bounds: interquartile range (IQR); upper whisker: 3rd quartile + 1.5 IQR; lower whisker: 1st quartile − 1.5 IQR). c Kaplan–Meier recurrence-free survival curves for each of the 500 bootstrap runs for patients identified by SpAn at low and high risk of 5-year CRC recurrence. d AUC violin and boxplots of the bootstrapped ROC curves achieved by six CRC-recurrence prediction models. The models are (1) clinical model, (2) biomarker expression model (denoted by intensity), (3) SpAn.null model (denoting SpAn without spatial-domain context), (4) biomarker expression + clinical model, (5) SpAn, and (6) SpAn + clinical model. Five hundred bootstraps were used. Figure S8 lists the statistical significance of the pairwise performance comparisons between all the six models. The gray and black dashed lines represent ROC curves with AUC of 75% and 85%, respectively. e Boxplots of stage-based area under the 500 bootstrapped ROC curves showing the stable stage-based clinical performance of SpAn. The black-solid line indicates an AUC of 50% corresponding to random guessing. f Stable temporal performance of SpAn illustrated by the time-dependent AUC values plotted as a function of time in years. The 95% confidence interval computed using the 500 bootstraps is also shown by the yellow shaded area around the mean time-dependent AUC values depicted by the black-solid curve. The 0.8 and 0.5 AUC values are shown for reference by the purple-dashed and black-solid lines, respectively.

